| Variable | SAAQ column | Definition |
|---|---|---|
| LT_TRK | IND_AUTO_CAMION_LEGER | Indicator of at least one automobile or light truck involved in the accident. |
| HVY_VEH | IND_VEH_LOURD | Indicator of at least one heavy vehicle involved in the accident. Heavy vehicle: heavy truck, road tractor, bus, school bus, minibus, tool or equipment vehicle. |
| MTRCYC | IND_MOTO_CYCLO | Indicator of at least one motorcycle or moped involved in the accident. |
| BICYC | IND_VELO | Indicator of at least one bicycle involved in the accident. |
| PED | IND_PIETON | Indicator of at least one pedestrian victim (injured or died) in the accident. |
2 What the data was hiding
Three problems had to be dealt with before any modelling could be trusted. All three were found by looking at the data rather than at the model, and one of them would have produced a respectable-looking result that meant nothing at all.
2.1 A variable that was the answer
Five variables record who was involved in a collision. They look alike, they are named alike, and four of them mean the same kind of thing. Table 2.1 gives the SAAQ’s definition of each.
Four of them say that a vehicle of some kind took part. The fifth says that a pedestrian was hurt. In the SAAQ’s French the four read impliqué, involved, and the fifth reads victime piéton, blessée ou décédée.
The difference in wording is not a small one. Severity above material damage is defined by the presence of a victim. So a pedestrian victim entails a victim, which entails a severity above material damage, by definition and not by any empirical relationship about roads. Table 2.2 shows what that looks like in the data.
| Indicator | Records | Material damage only | Minor injury | Serious or fatal |
|---|---|---|---|---|
| Car or light truck | 1,604,462 | 81.9% | 17.1% | 1.0% |
| Heavy vehicle | 215,095 | 86.6% | 12.0% | 1.4% |
| Motorcycle or moped | 37,291 | 28.9% | 61.9% | 9.2% |
| Bicycle | 25,691 | 22.6% | 72.9% | 4.6% |
| Pedestrian victim | 30,455 | 0.0% | 88.1% | 11.9% |
Every other indicator leaves the outcome open. A heavy vehicle can be involved in a collision that hurts nobody, and usually is. A pedestrian victim cannot be involved in a collision that hurt nobody, because that is what the words mean. The first column of that row is exactly zero, and no quantity of data would ever move it.
A model given this variable is being rewarded for restating the question. The variable is also useless to an engineer: nobody designing an intersection knows in advance whether a pedestrian will be hurt at it.
NoteHow the variable came to light
Not by reading the column names, which is how it was missed in the first place. Five estimator families with very different inductive biases all scored within 0.01 of each other on Matthews correlation, which is what a lookup table looks like rather than what learning looks like, and going back to the published definitions explained why.
Removing it moved the aggregate score less than expected: on the headline configuration the Matthews correlation fell by roughly 0.03. So this was not a result held up entirely by leakage. It was a small effect that was nonetheless wholly illegitimate, which is the awkward case: too small to be obvious, too circular to keep.
The project now checks for this rather than relying on anyone reading carefully. Two tests are applied to every candidate variable. The first asks whether any value is followed by exactly one outcome. The second, stricter test, the one that catches victim indicators, asks whether any value makes some outcome impossible.
| feature | value | excluded_class | n | expected |
|---|---|---|---|---|
| PED | Y | 0 | 30455 | 24825.564977 |
The distinction matters because the weaker test misses it. PED = Y does not determine a single outcome: a pedestrian victim may be minor or serious. What it does is rule out the mildest class entirely, and an impossibility is as much a definition as a certainty.
2.2 Blank fields are not blank at random
Not every field is completed on every report, and the pattern of what is left empty carries information about the outcome. Figure 2.1 shows how the outcome distribution shifts as more fields are left blank.
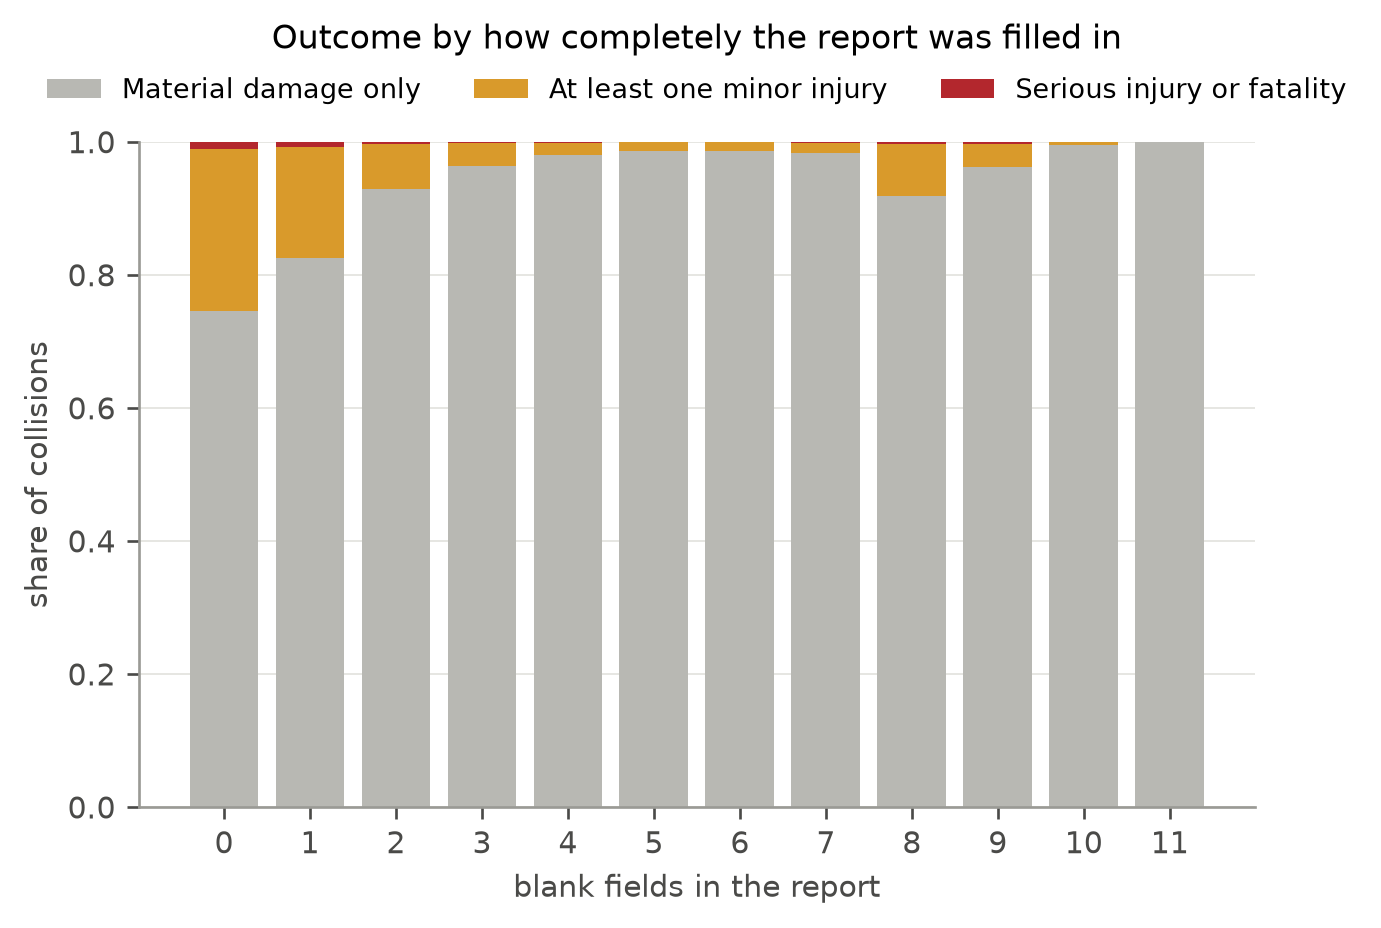
The trend runs close to monotone across the range, and steeply. A report with nothing left blank is far more likely to describe an injury than one with several fields empty; a report with almost everything blank describes property damage almost every time.
The mechanism is not mysterious. A collision that hurt somebody produces a thorough report, because there is an injured person, an ambulance, a possible prosecution and an insurance claim of some size. A collision that bent a bumper produces a cursory one. Report completeness tracks severity because both track how serious the event was, and neither is a fact about the road.
In the vocabulary of missing data this is neither missing completely at random nor missing at random: the probability that a field is blank depends on the outcome itself, which is the case that cannot be imputed away (Rubin, 1976).
Table 2.4 breaks it down by variable.
| Variable | Blank on | P(no injury) when blank | P(no injury) when filled | Relative risk of class 2 |
|---|---|---|---|---|
| Speed limit | 85,689 | 0.874 | 0.765 | 0.541 |
| Road configuration | 25,611 | 0.945 | 0.783 | 0.306 |
| Location along road | 22,232 | 0.934 | 0.786 | 0.362 |
| Time of day | 20,429 | 0.963 | 0.785 | 0.225 |
| Weather | 15,898 | 0.961 | 0.788 | 0.238 |
| Lighting | 15,365 | 0.969 | 0.788 | 0.202 |
| Road surface | 14,897 | 0.962 | 0.789 | 0.285 |
| Road alignment | 11,989 | 0.958 | 0.791 | 0.263 |
| Type of collision | 11,523 | 0.969 | 0.791 | 0.156 |
| Surroundings | 8,584 | 0.927 | 0.794 | 0.412 |
| Road category | 8,161 | 0.926 | 0.794 | 0.420 |
Read the final column. A value below one means that a blank in that field accompanies a lower rate of serious injury than a completed one. Every variable in the table is below one, several of them far below.
This is available to any model, and every model will use it. For prevention it is useless, since nobody planning a road knows how thoroughly a future report about it will be filled in. A model that has learned “sparse report, therefore minor collision” has learned something true and worthless.
2.2.1 What the cap costs
The remedy used here is blunt: discard reports with more than one blank field among the variables being modelled. That removes the steep part of the trend while keeping the bulk of the data.
The cost falls unevenly. Blanks concentrate on the mildest collisions, so the filter removes far more of the majority class than of the severe one. Table 2.5 gives both figures.
Both columns describe the same records. The split into training and held-out parts is taken before any filter is applied, so the capped training set is a subset of the uncapped one rather than a differently drawn sample, and the retained proportions are exact rather than estimated. Appendix B explains why the ordering matters.
| Outcome | Uncapped | At most one blank | Retained |
|---|---|---|---|
| Material damage only | 224,129 | 181,300 | 80.9% |
| At least one minor injury | 54,331 | 52,313 | 96.3% |
| Serious injury or fatality | 2,419 | 2,312 | 95.6% |
Retaining a larger share of the severe records than of the mild ones is the right direction, since the severe class is the scarce one and the one the analysis is about. Overall the cap keeps 84.0% of the records available for fitting.
The cap also shifts the class balance, which is better stated here than discovered later. The serious and fatal class rises from 0.86% of records to 0.98%. The scarce class becomes slightly less scarce, which helps, though not by much: the problem remains one where roughly ninety-nine collisions in a hundred are not the ones being looked for.
NoteThe cap counts blanks over the variables actually used
An earlier version of this counted blanks over a candidate list that still included the work-zone indicator described in Chapter 1, a field blank on roughly 98% of records. Nearly every report therefore began with one blank before anything else was considered, and a cap of one blank was in practice a cap of zero.
The effect was to discard about a third of the data for a reason that had nothing to do with report quality. Withholding that variable, for the separate reasons given in Chapter 1, removes the problem.
2.3 An undocumented value
One further oddity, small enough to be a footnote and recorded because recording it costs nothing.
| Variable | SAAQ column | Documented values | Found but undocumented |
|---|---|---|---|
| Lighting | CD_ECLRM | 1, 2, 3, 4 | 0 |
The lighting variable is documented as taking four values. Four records across the twelve years carry a fifth, which the documentation does not define: two in 2012, one in 2014, one in 2016. Scattered across separate years rather than confined to a period, so this is data entry rather than a change of coding practice.
No meaning can be assigned to a code the documentation does not define, so none is assigned. Such values are read as unrecorded. The coercion is declared in the schema rather than performed silently, and its count is logged every time the data is compiled, which is why the compiled extract no longer contains them and this table lists the declaration rather than a count. Should four records ever become four thousand, the log would report it.
2.4 Nothing else answers the question
With the pedestrian indicator removed, the same two tests were applied to every remaining variable. Neither finds anything: no value determines an outcome, and no value rules one out.
The near misses are still instructive, because the closest of them is exactly the case a careless reading would treat as leakage.
| Type of collision | Records | No injury | Minor injury | Serious or fatal |
|---|---|---|---|---|
| not recorded | 13,623 | 0.969 | 0.030 | 0.001 |
| cyc | 9,367 | 0.232 | 0.732 | 0.036 |
| fxd obj | 30,066 | 0.833 | 0.156 | 0.011 |
| no coll | 6,745 | 0.591 | 0.391 | 0.018 |
| oth | 4,699 | 0.945 | 0.052 | 0.003 |
| ped | 14,542 | 0.145 | 0.776 | 0.079 |
| veh | 251,404 | 0.846 | 0.150 | 0.004 |
A collision recorded as involving a pedestrian is overwhelmingly likely to have hurt somebody. Certainty is another matter, and the gap between the two is the whole distinction. Roughly one pedestrian collision in seven produced no injury at all, which is thousands of records rather than a rounding error. The variable is therefore evidence, and strong evidence, rather than a restatement of the outcome.
That figure also disposes of a worry that could not otherwise be settled from inside the data. If collisions with unharmed pedestrians simply went unreported, this variable would behave like an outcome through the reporting process rather than through its definition, and nothing in the extract would reveal it. A cell containing thousands of unharmed pedestrians says that is not happening.
2.5 Why this chapter comes first
None of the above is about modelling. All of it had to be settled before modelling, because each item changes what a subsequent number means.
The pedestrian indicator would have inflated every result. The blank fields would have supplied a real but useless signal that no amount of validation would have flagged, since it generalises perfectly to held-out data and is wrong for reasons validation cannot see. The undocumented value is trivial, but the habit of recording rather than silently repairing is what made the other two findable.
Chapter 3 asks how well any method could do with what remains.