| Variable | SAAQ column | Name | Values | Blank permitted | Blank observed |
|---|---|---|---|---|---|
| YEAR | AN | Year | not enumerated | no | 0.0% |
| ASPECT | CD_ASPCT_ROUTE | Road alignment | 2 | yes | 2.6% |
| PUB_PRIV_RD | CD_CATEG_ROUTE | Road category | 2 | yes | 1.4% |
| WEATHER | CD_COND_METEO | Weather | 10 | yes | 2.8% |
| RD_CONFG | CD_CONFG_ROUTE | Road configuration | 4 | yes | 8.7% |
| LIGHT | CD_ECLRM | Lighting | 4 | yes | 2.7% |
| ZONE | CD_ENVRN_ACCDN | Surroundings | 7 | yes | 1.7% |
| RD_COND | CD_ETAT_SURFC | Road surface | 11 | yes | 2.7% |
| ACCDN_TYPE | CD_GENRE_ACCDN | Type of collision | 7 | yes | 7.6% |
| LONG_LOC | CD_LOCLN_ACCDN | Location along road | 6 | yes | 7.0% |
| RDWX | CD_ZON_TRAVX_ROUTR | Work zone | 1 | no | 97.8% |
| SEVERITY | GRAVITE | Severity | 4 | no | 0.0% |
| HOUR | HR_ACCDN | Time of day | 6 | yes | 3.4% |
| LT_TRK | IND_AUTO_CAMION_LEGER | Car or light truck | 2 | no | 0.0% |
| MTRCYC | IND_MOTO_CYCLO | Motorcycle or moped | 2 | no | 0.0% |
| PED | IND_PIETON | Pedestrian victim | 2 | no | 0.0% |
| HVY_VEH | IND_VEH_LOURD | Heavy vehicle | 2 | no | 0.0% |
| BICYC | IND_VELO | Bicycle | 2 | no | 0.0% |
| WKDY_WKND | JR_SEMN_ACCDN | Day of week | 2 | no | 0.0% |
| MONTH | MS_ACCDN | Month | 12 | no | 0.0% |
| NUM_VEH | NB_VEH_IMPLIQUES_ACCDN | Vehicles involved | 3 | yes | 0.0% |
| NUM_VICTIMS | NB_VICTIMES_TOTAL | Victims | 4 | no | 0.0% |
| ID | NO_SEQ_COLL | Report number | not enumerated | no | 0.0% |
| REGION | REG_ADM | Administrative region | 17 | yes | 0.0% |
| SPD_LIM | VITESSE_AUTOR | Speed limit | 7 | yes | 22.8% |
1 The record
1.1 Where it comes from
When police attend a collision in Quebec they complete a report. The Société de l’assurance automobile du Québec collects those reports and publishes an extract of them through Données Québec (Société de l’assurance automobile du Québec, 2017). This book uses every report published for the years 2011 to 2022 inclusive: 1,717,407 of them.
The purpose of that publication bears stating at the outset. The SAAQ administers Quebec’s public automobile insurance scheme and reports annually on road safety. The extract exists to serve those two purposes: to establish who was involved in what, and to count how many collisions of each kind occurred, which makes it an accounting record. Asking it a question it was not built to answer is the substance of this book, and the answer turns out to depend far more on what the record contains than on how cleverly one asks.
1.2 What a report records
Twenty-five variables, listed in Table 1.1. They fall into four groups: when the collision happened, where, who was involved, and how it turned out.
The final two columns of Table 1.1 report different things, and the difference matters.
Blank permitted describes the documentation. Thirteen variables carry a row in the SAAQ’s data dictionary reading “Non précisé”, with the corresponding value cell left empty. For those, a blank field is a documented state: the code for “not specified” is the absence of a code.
Blank observed describes the data: the fraction of published records on which the field is in fact empty.
For most variables the two agree in the way one would expect. For one they disagree completely, and the disagreement is instructive.
WarningThe work-zone indicator is documented for one value only
CD_ZON_TRAVX_ROUTR records whether the collision happened in or near a road work zone. The published documentation defines a single value, meaning yes, and sub-divides it into “approaching the zone” and “within the zone”. It defines no value for “not in a work zone”, and it carries no “Non précisé” row either.
The data is empty on 97.8% of records.
So a blank here might mean the collision was not in a work zone, or it might mean the field was not filled in. Nothing in the documentation distinguishes them.
Either reading could be defended, and they describe different variables. On the first this is a complete binary indicator; on the second it is almost entirely absent. Choosing one silently would be an inference dressed as a fact.
This book therefore sets the variable aside. Every feature set excludes it, the exclusion is declared once in the schema rather than arrived at by accident, and the codebook records the ambiguity where anyone reading the variable’s definition will meet it.
Most of them are coarse. Time of day is recorded in four-hour bands rather than as a clock time. Speed limit takes one of seven values, and records the limit posted on the road rather than the speed anybody was travelling. Location along the road distinguishes an intersection from a point more than a hundred metres away from one, and nothing finer than that. Weather has ten categories and lighting has four.
The coarseness is not an oversight. A form completed at the roadside by an officer with other things to attend to has to be quick, and a categorical answer is quick. It does, however, set a limit on what the resulting data can distinguish, and Chapter 3 is largely concerned with measuring that limit.
ImportantEvery variable is recorded after the fact
The report is completed once the collision has already happened. Nothing in it describes a state of affairs that existed beforehand, and the severity of the collision is not inferred from the other fields; it is recorded alongside them on the same form.
The question this data can therefore support is a retrospective one. Given collisions recorded like this one, what became of them? The answer is a distribution over past outcomes, which is exactly what the explorer at the front of this book reports.
1.3 What it does not record
The absences matter more than the coarseness, and they are systematic. Nowhere in the extract is there any record of:
- the speed anybody was actually travelling
- whether alcohol or drugs were involved
- whether occupants were wearing seatbelts, or children properly restrained
- the age or experience of any driver
- the mass, age or safety rating of any vehicle
- traffic volume on the road at the time
- how long it took anyone to reach hospital
That list is close to a summary of what determines whether a collision hurts somebody. Speed above all: kinetic energy grows with the square of it, and the relationship between speed and injury severity is among the best established findings in road safety (Elvik, 2005). The extract records the posted limit, which is a fact about the road, and says nothing at all about compliance.
Some of this is collected elsewhere. Toxicology results exist, coroners’ reports exist, hospital records exist. None of it appears here, and linking them is a matter for an authority with the mandate to do so rather than for anyone working from a published extract.
1.4 How severity is recorded
Severity is the outcome this book asks about, and the SAAQ records it on the four-level scale defined in Table 1.2.
| Level | Definition |
|---|---|
| Fatal/serious | At least one victim died within 30 days following the accident or no death and at least one victim seriously injured (injuries requiring hospitalization, including those for which the person remains under observation in hospital). |
| Minor | Only one or more victims lightly injured (injuries not requiring hospitalization or observation of the person, even if they require treatment by a doctor or in a hospital center). |
| Mat | No victims, and the damage assessment is above the reporting threshold (threshold of $2,000 since March 2010). |
| Mat < 2000 | No victims, and the assessment of damage is less than or equal to the reporting threshold (threshold of $2,000 since March 2010). |
Two features of that scale deserve attention.
The first is that the lowest two levels differ only by a threshold on the estimated cost of repair, set at two thousand dollars since March 2010. Whether a collision falls above or below that line says something about an insurance claim and nothing about anybody’s safety. Where this book asks about injury it therefore uses a three-level scale, merging those two. Where it simply displays the record, as the explorer does, it keeps all four. Both are available throughout, and the active one is always stated.
The second is that severity is not established at the scene. The published definition of the severest class turns on a victim having died within thirty days, or on an injury having required hospitalisation. Neither is knowable while the officer is still standing on the road, so the field records the outcome as it was eventually determined rather than as it appeared at the time.
Defining it that way is right, and it makes the classification depend on administrative follow-up. Nothing in the extract says how complete that follow-up is, how promptly a record is amended, or where the line falls when a person is held for observation rather than admitted. Those are questions about a process this data cannot see.
The imbalance in Table 1.3 is the central difficulty of everything that follows. Roughly four collisions in five damaged property and hurt nobody. Roughly one in a hundred seriously hurt or killed somebody. A model that answered “material damage” every single time would be right about eighty percent of the time and would have learned nothing whatever, which is why accuracy appears in this book only alongside the figure it has to be compared against.
1.5 The codebook
The SAAQ documents this dataset in French, in a seven-page PDF giving each variable’s name, its permitted values, and a definition of each value. That documentation is the authority on what everything means, and the machine-readable codebook this project carries reproduces it in full, alongside an English translation prepared here. Table 1.4 shows one variable in both languages.
| Value | Definition (EN) | Definition (FR) |
|---|---|---|
| Public | Public road. Examples: numbered road, ramp, highway collector, service road, main artery, residential street, path, row, alley. | Chemin public. Exemples: route numérotée, bretelle, collecteur d'autoroute, voie de service, artère principale, rue résidentielle, chemin, rang, ruelle. |
| Private | Off public roads. Examples: parking lot, private land, private road, forest road, marked trail. | Hors chemin public. Exemples: terrain de stationnement, terrain privé, chemin privé, chemin forestier, sentier balisé. |
The definitions are administrative rather than everyday, and reading them changes what some variables appear to mean. A “public road” here includes ramps, service roads and laneways; a private one includes parking lots and forest tracks. The distinction concerns jurisdiction, not traffic. Anyone using this data without reading the definitions will import assumptions the SAAQ never made.
Where the two languages differ, the French is authoritative. The English is a translation, and any error in it is mine.
1.6 When collisions happen, and when they hurt people
Figure 1.1 and Figure 1.2 show collision counts across the year and across the day, with the share that were serious or fatal drawn over them.
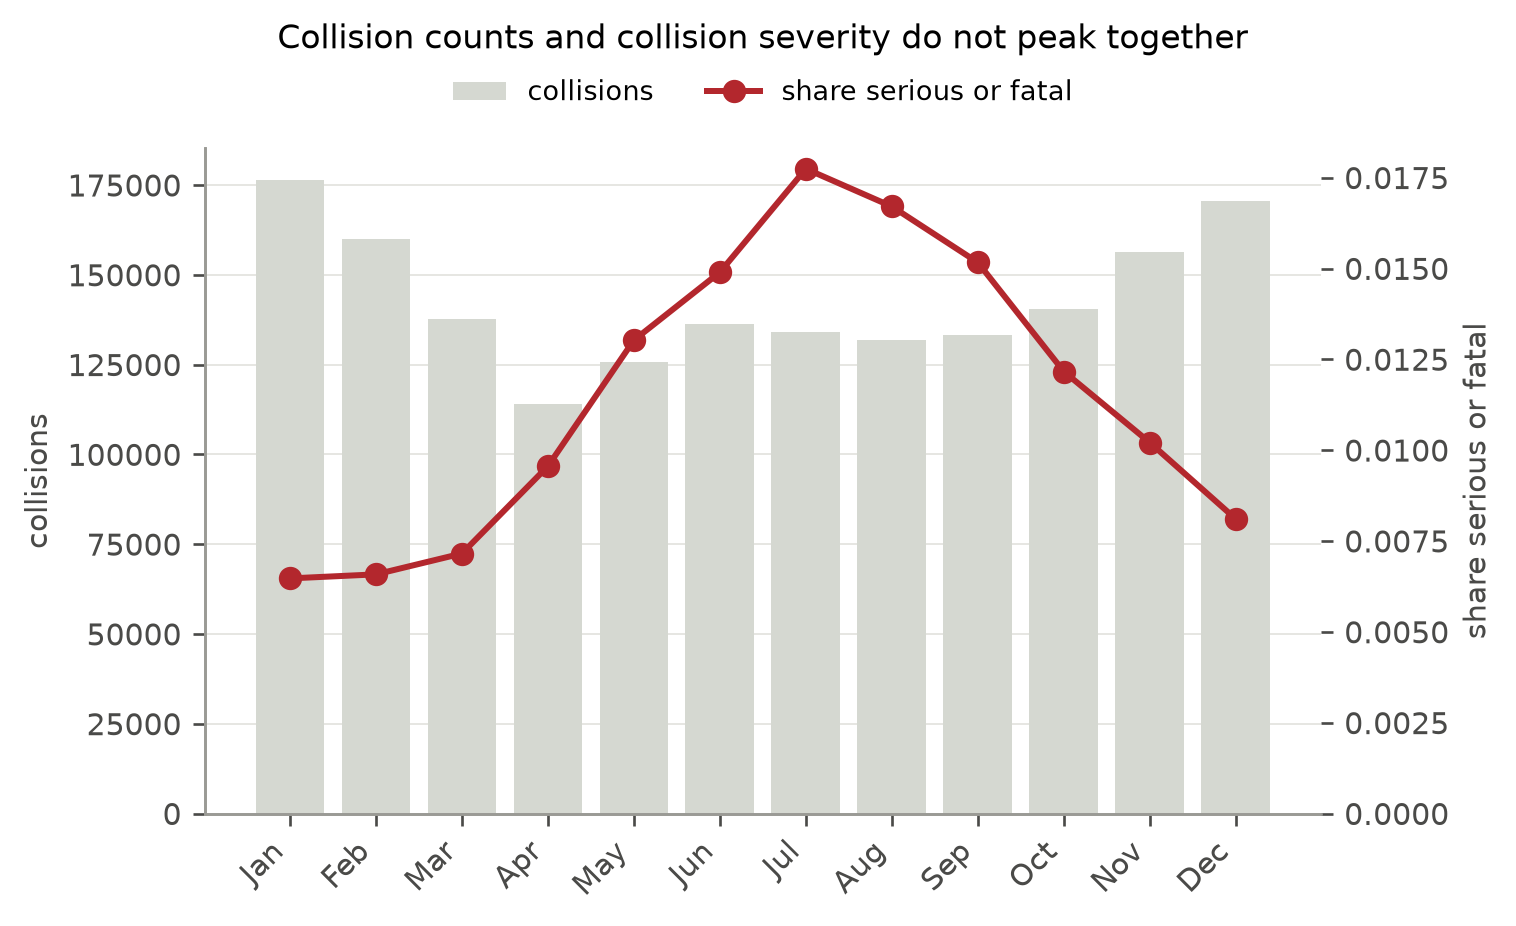
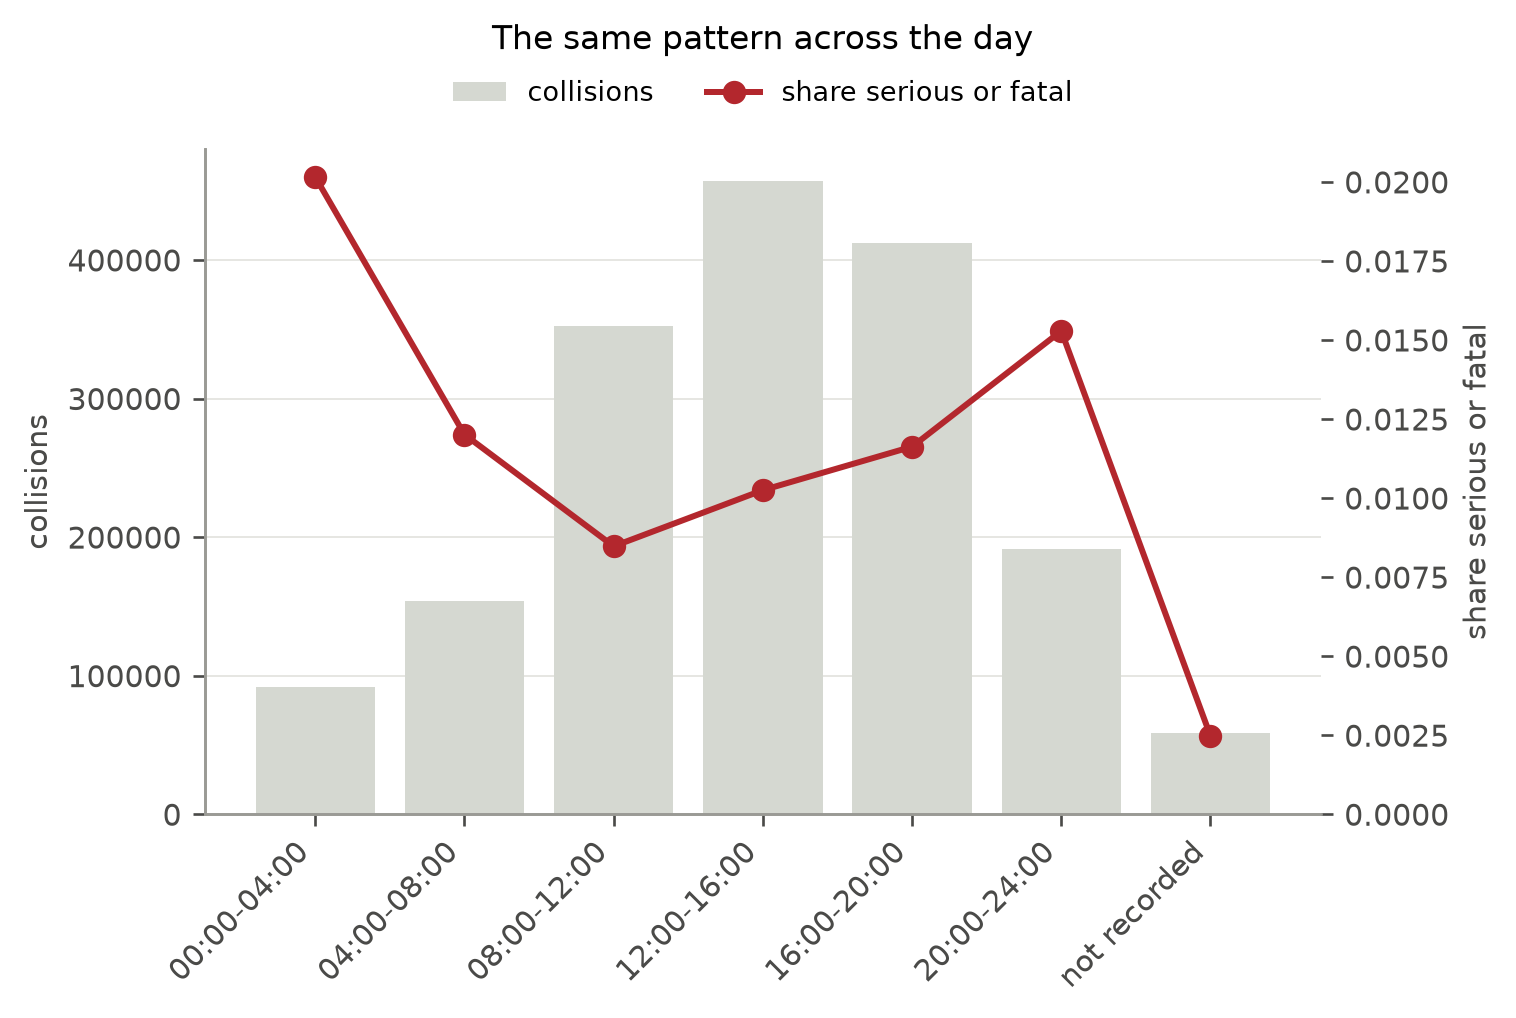
Neither figure is here for the seasonal pattern itself, which is not surprising and not useful. They are here for three other reasons.
The first is a check, and a weak one, which needs saying. Any collision dataset will show more collisions in a Quebec winter and more at five in the afternoon than at five in the morning. If these figures showed something else, that would point to a broken date field, a mis-parsed extract or a filter applied without noticing. They do not, so nothing is obviously wrong. The evidence runs one way only: failure here would have been informative, and success is close to uninformative.
The second is that frequency and severity are separate things, which the rest of the book depends on and which a single count would obscure. Where they move together, a reader can safely use one as a proxy for the other. Where they diverge, as they appear to here, a policy aimed at reducing collisions and a policy aimed at reducing harm are aimed at different targets.
The third is that these figures already show the difficulty the whole book runs into. Suppose the severe share does peak in the warmer months and the small hours. Several explanations fit: higher speeds where the roads are clear, more people walking and cycling, alcohol, a different population out at those times, lower traffic volumes permitting greater speeds. Every one of them is plausible and this data distinguishes none of them, because it records none of the quantities involved. Chapter 4 returns to exactly this problem, with the same answer.
1.7 Blank fields
Not every field is filled in on every report. Some variables are blank on a substantial fraction of records, as Table 1.5 shows.
| Variable | Column | Blank |
|---|---|---|
| Work zone | RDWX | 97.8% |
| Speed limit | SPD_LIM | 22.9% |
| Road configuration | RD_CONFG | 8.7% |
| Type of collision | ACCDN_TYPE | 7.6% |
| Location along road | LONG_LOC | 7.0% |
| Time of day | HOUR | 3.4% |
| Weather | WEATHER | 2.8% |
| Lighting | LIGHT | 2.7% |
| Road surface | RD_COND | 2.7% |
| Road alignment | ASPECT | 2.6% |
| Surroundings | ZONE | 1.7% |
| Road category | PUB_PRIV_RD | 1.4% |
The documentation admits this for thirteen variables, which carry a “Non précisé” row with a blank code: for those, an empty field is a documented state rather than a failure to record one. The rates are nonetheless higher than one might expect, and one of them matters a great deal. Speed limit is blank on close to a quarter of records, and speed limit is among the more plausibly relevant things the extract contains.
Whether a field was filled in also turns out to carry information about the outcome, which is a fact about how reports get written rather than about how collisions happen. Chapter 2 takes that up, because it has to be dealt with before any modelling can be trusted.
1.8 The population this book studies
The chapters that follow narrow the data in three ways. Each narrowing is argued for where it is made, and stated wherever a figure depends on it.
To Montréal. The Vision Zero programme this book takes its title from is a municipal one (Ville de Montréal, 2019), and asking what a city can change makes more sense within one city than across a province of very different road environments. Montréal contributes 330,446 of the 1,717,407 published reports. The explorer at the front of this book is not narrowed at all, and region is one of the variables it can be sliced by, so nothing here prevents the same questions being asked elsewhere.
To three severity levels, merging the two material-damage categories, for the reason given above.
To adequately completed reports, for the reason given in Chapter 2.
Table 1.6 records what each step costs.
| Step | Records |
|---|---|
| Published extract | 1,717,407 |
| Montréal only | 330,446 |
| At most one blank field | 277,482 |
| Available for fitting | 235,925 |
| Held out until the end | 41,557 |
Keep the final row in mind. Those records are set aside before any analysis begins and are not looked at again until Chapter 5. Every figure in the intervening chapters is computed by cross-validation within the 235,925 records available for fitting, and none of them has seen the held-out set.