# Worked examples {#sec-worked}
Three larger runs, putting the whole pipeline together at $e^{20}$ and $e^{21}$: many interval lengths at once, the discrepancy measures across all of them, and a nested animation. The heavy computations were run once and saved; the cells that took minutes to hours are displayed but not executed, and everything downstream retrieves from the database. The folded cell below defines the `pick` helper of @sec-retrieve.
{{< include _pick.qmd >}}
```{python}
import matplotlib.pyplot as plt
import pandas as pd

import primes_in_intervals as pii
from primes_in_intervals import (
    analyze,
    compare,
    intervals,
    nest,
    plot_distribution_frame,
    retrieve,
    save,
    score,
)
```
All the windows in this chapter are centred at a point $x_0$ of the form $[e^k]$, and we describe them in the text boxes of the figures as $x_0 - K < a \le x_0 + K$. The small function below builds such a text box. Given the dataset, the checkpoint, $H$ and the predictions being drawn, it returns the text, quoting $\mu$ from the very predictions on the plot. (In the notation of @sec-compare, the window is $M < a \le M + N$ with $M = x_0 - K$ and $N = 2K$.)
```{python}
def centred_overlay(x0, x0_label, variable=r'$X = \pi(a + H) - \pi(a)$', start='a', extra=''):
    """Return an overlay function for windows centred at x0."""
    def overlay(X, c, H, pred):
        upper = c[1] if isinstance(c, tuple) else c
        s = X['statistics'][c]
        med = int(s['med']) if s['med'] == int(s['med']) else s['med']
        return (variable + '\n\n'
                + fr'$x_0 - K < {start} \leq x_0 + K$' + '\n\n'
                + fr'$H = {H}$, $x_0 = {x0_label}$, $K = {upper - x0}$' + '\n\n'
                + extra
                + fr'$\mu = {pred["mu"]:.5f}$' + '\n\n'
                + r'$\mathbb{E}[X] = $' + f"{s['mean']:.5f}" + '\n\n'
                + r'$\mathrm{Var}(X) = $' + f"{s['var']:.5f}" + '\n\n'
                + fr'median : ${med}$' + '\n\n'
                + fr"mode(s): ${s['mode']}$")
    return overlay
```
## Example 4 {#sec-eg4worked}
Ten interval lengths over one window about $e^{20}$.
```{python}
N = int(np.exp(20))
HH = [20,30,40,50,60,70,80,90,100,200]
step = 10**3
A = N - 10**5
B = N + 10**5
C = list(range(A,B+1,step))
```
Ten passes over the primes up to half a billion: the computation below took a little under an hour, so it is shown, not run.
```{python}
#| eval: false
exp20 = { H : {} for H in HH}
start = timer()
for H in HH:
    exp20[H] = intervals(C,H,interval_type='overlap')
end = timer()
end - start
```
```
3146.539329699939
```
```{python}
#| eval: false
for H in HH:
    save(exp20[H])
```
Retrieval brings all ten datasets back. Other datasets share some of these interval lengths, so, as always, we select by lower bound with `pick` rather than by position; the printed summaries list everything each length matched.
```{python}
getexp20 = {}
for H in HH:
    getexp20[H] = pick(retrieve(H), A)
```
We analyze, compare and score all ten.
```{python}
for H in HH:
    analyze(getexp20[H])
    compare(getexp20[H])
    score(getexp20[H])
```
At the final checkpoint, which covers all two hundred thousand starting points of the window, here are $\mu$, the discrepancy $E_1$ of each prediction on the central range, and the ratio $E_1(F)/E_1(F_0)$, for every length:
```{python}
rows = {}
for H in HH:
    X = getexp20[H]
    c = max(X['data'])
    s = X['scores'][c]
    rows[H] = {'mu': X['prediction_parameters'][c]['mu'],
               'm range': f"{s['central']['F']['m_lo']}..{s['central']['F']['m_hi']}",
               'E1(Binom)': s['central']['B']['E1'],
               'E1(F0)': s['central']['F0']['E1'],
               'E1(F)': s['central']['F']['E1'],
               'E1(F)/E1(F0)': s['ratio']['central']['E1']}
pd.DataFrame.from_dict(rows, orient='index').rename_axis('H')
```
The correction reduces $E_1$ at every length, by a factor of between two and five. On the whole it helps less as $H$ grows (the ratio rises from about $0.2$ at $H = 20$ to $0.44$ at $H = 200$, though not steadily).
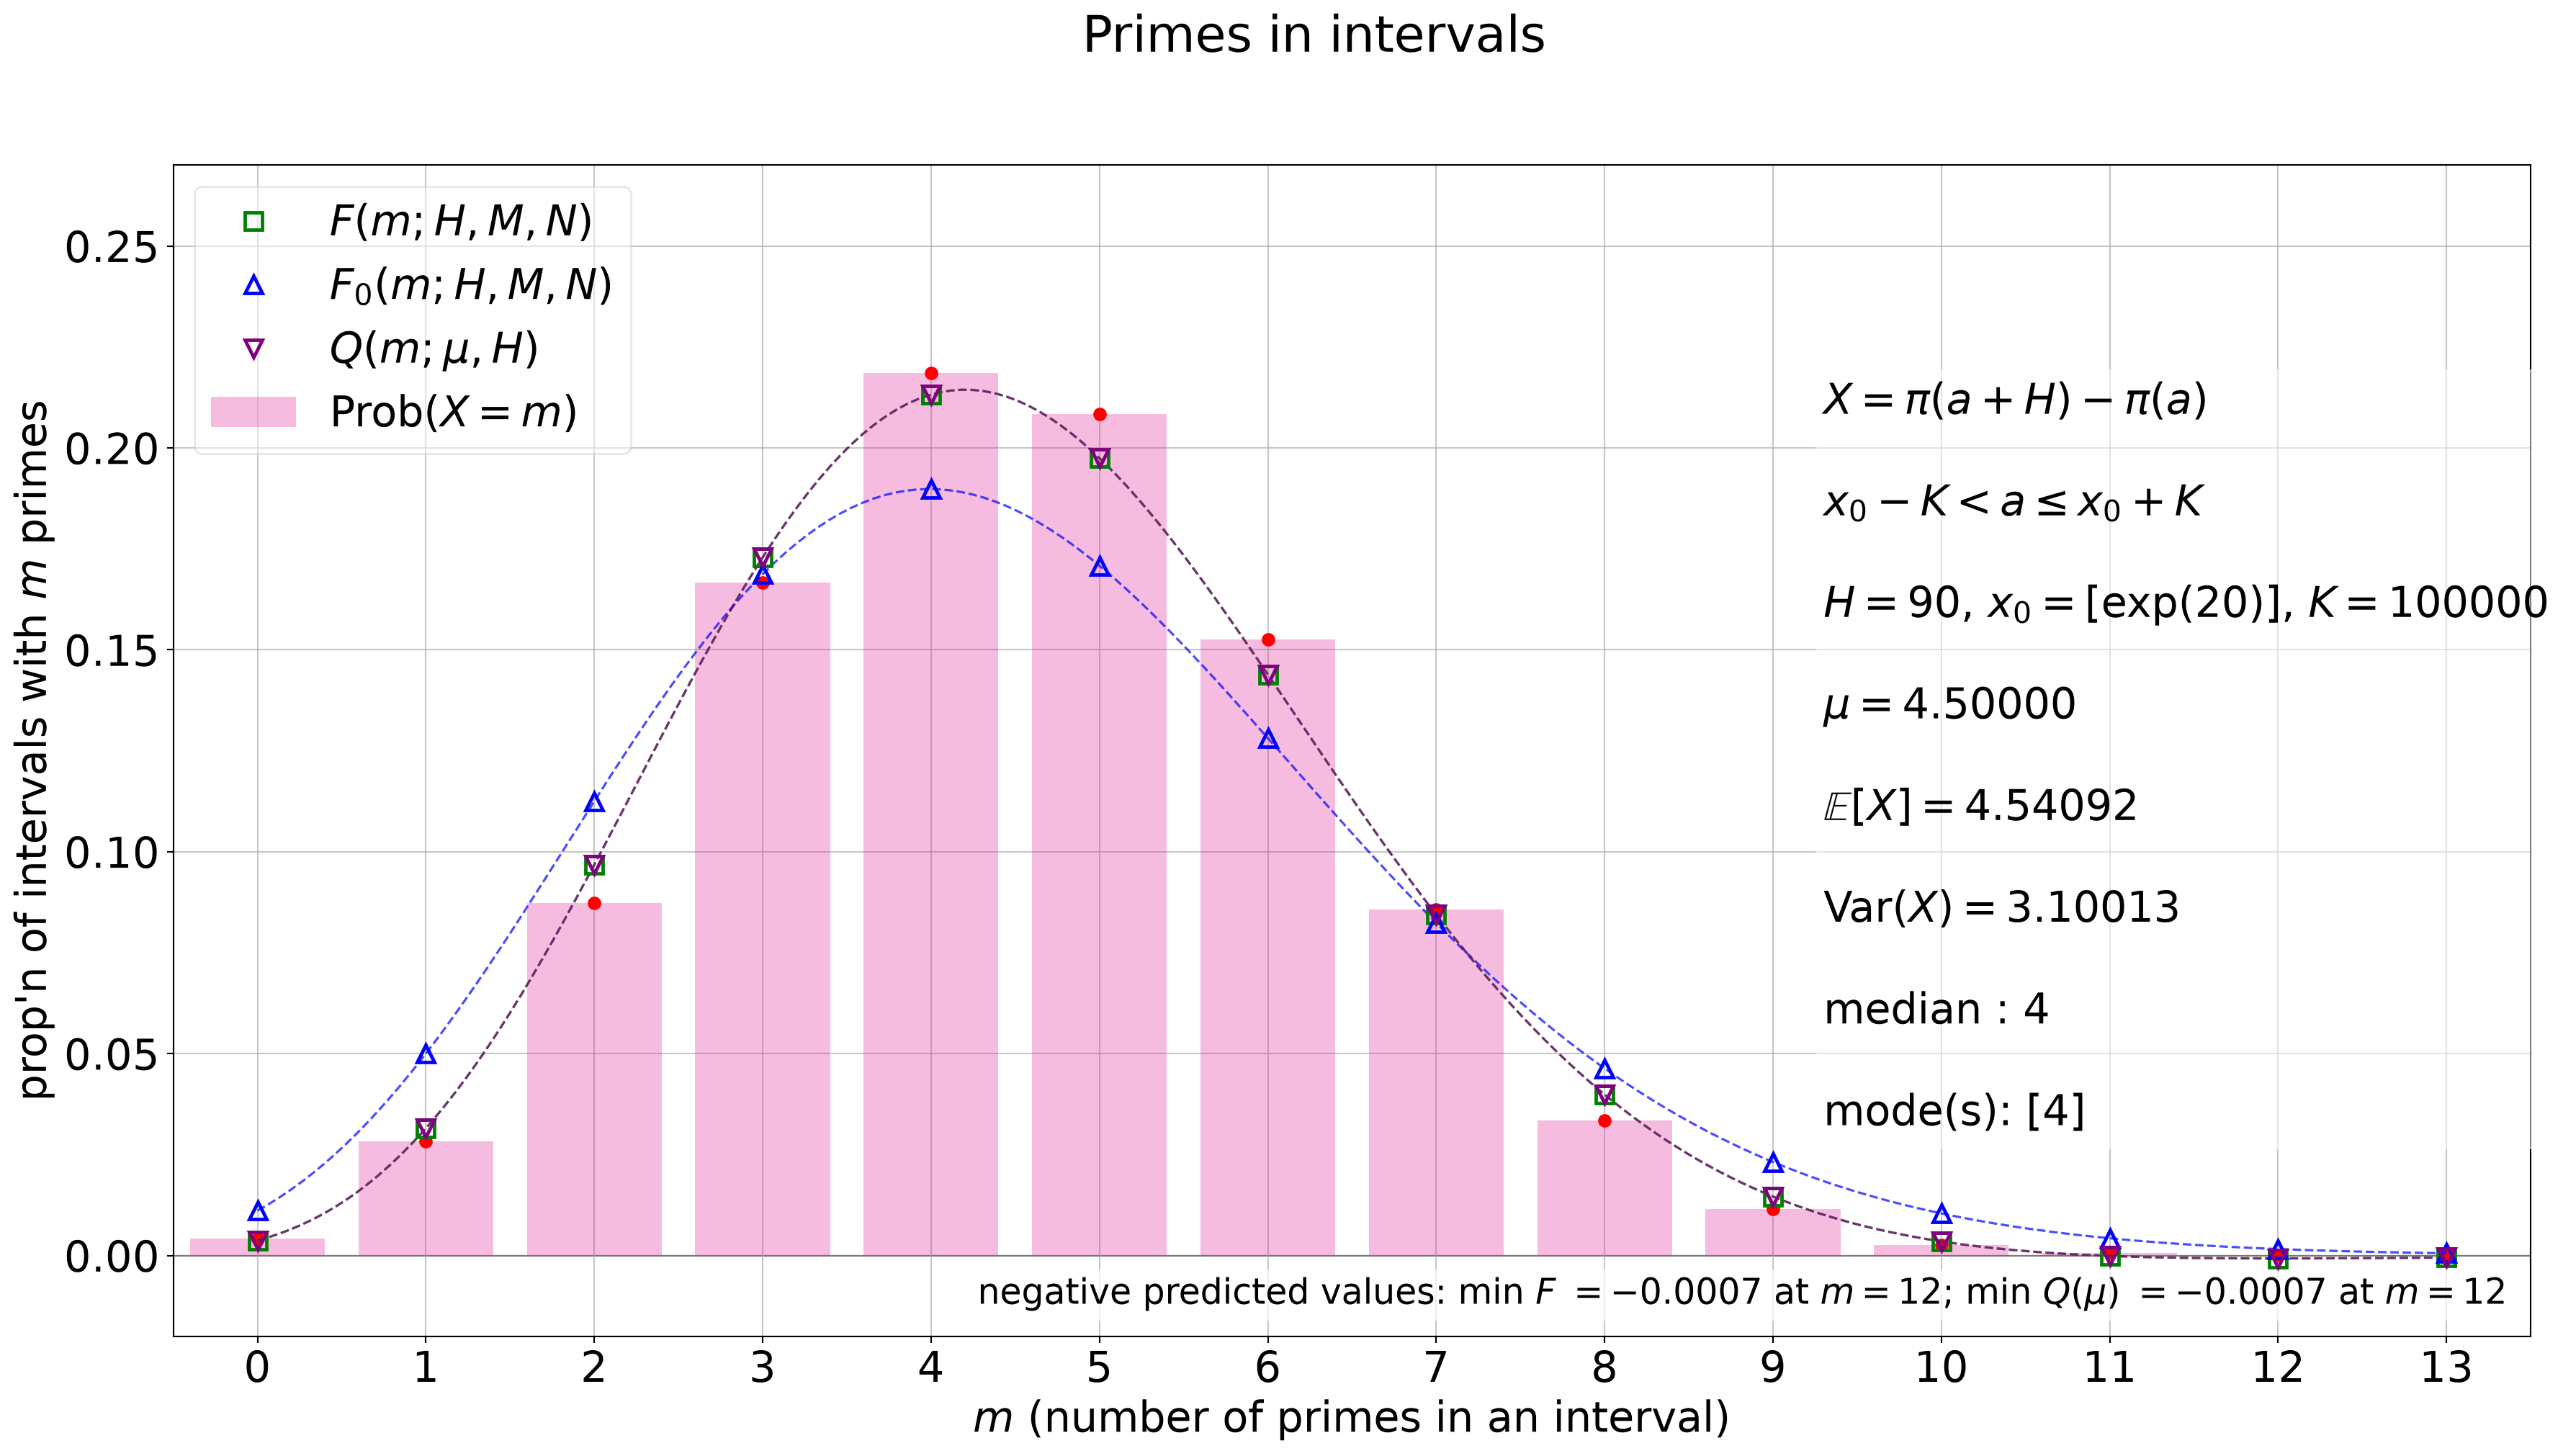
Now the plot, for $H = 90$. Besides $F$ and $F_0$ we draw the local expression $Q(m; \mu, H)$, evaluated at the single averaged parameter; the density of primes barely changes across a window this narrow, so the purple markers of $Q(m; \mu, H)$ sit almost exactly on the green markers of $F$.
```{python}
H = 90 # 20,30,40,50,70,80,200
X = getexp20[H]
C = list(X['distribution'].keys())

plt.rcParams.update({'font.size': 22})
fig, ax = plt.subplots(figsize=(22, 11))
fig.suptitle('Primes in intervals')
plot_distribution_frame(ax, X, C[-1], models=('F', 'F0', 'Q_mu'),
                        overlay=centred_overlay(N, r'[\exp(20)]'), overlay_position=(0.70, 0.18))
plt.rcParams['savefig.facecolor'] = 'white'
plt.show()
```
## Example 5 {#sec-eg5worked}
The same window about $e^{20}$, now at the single length $H = 76$. The computation ran once (several minutes) and was saved:
```{python}
#| eval: false
x0 = int(np.exp(20))
K = 10**5
H = 76
A = x0 - K
B = x0 + K
step = 10**3
C = list(range(A, B + 1, step))
N_exp20_H_76 = intervals(C, H)
```
```{python}
N_exp20_H_76 = pick(retrieve(76), 485065195)
```
```{python}
analyze(N_exp20_H_76)['header']
```
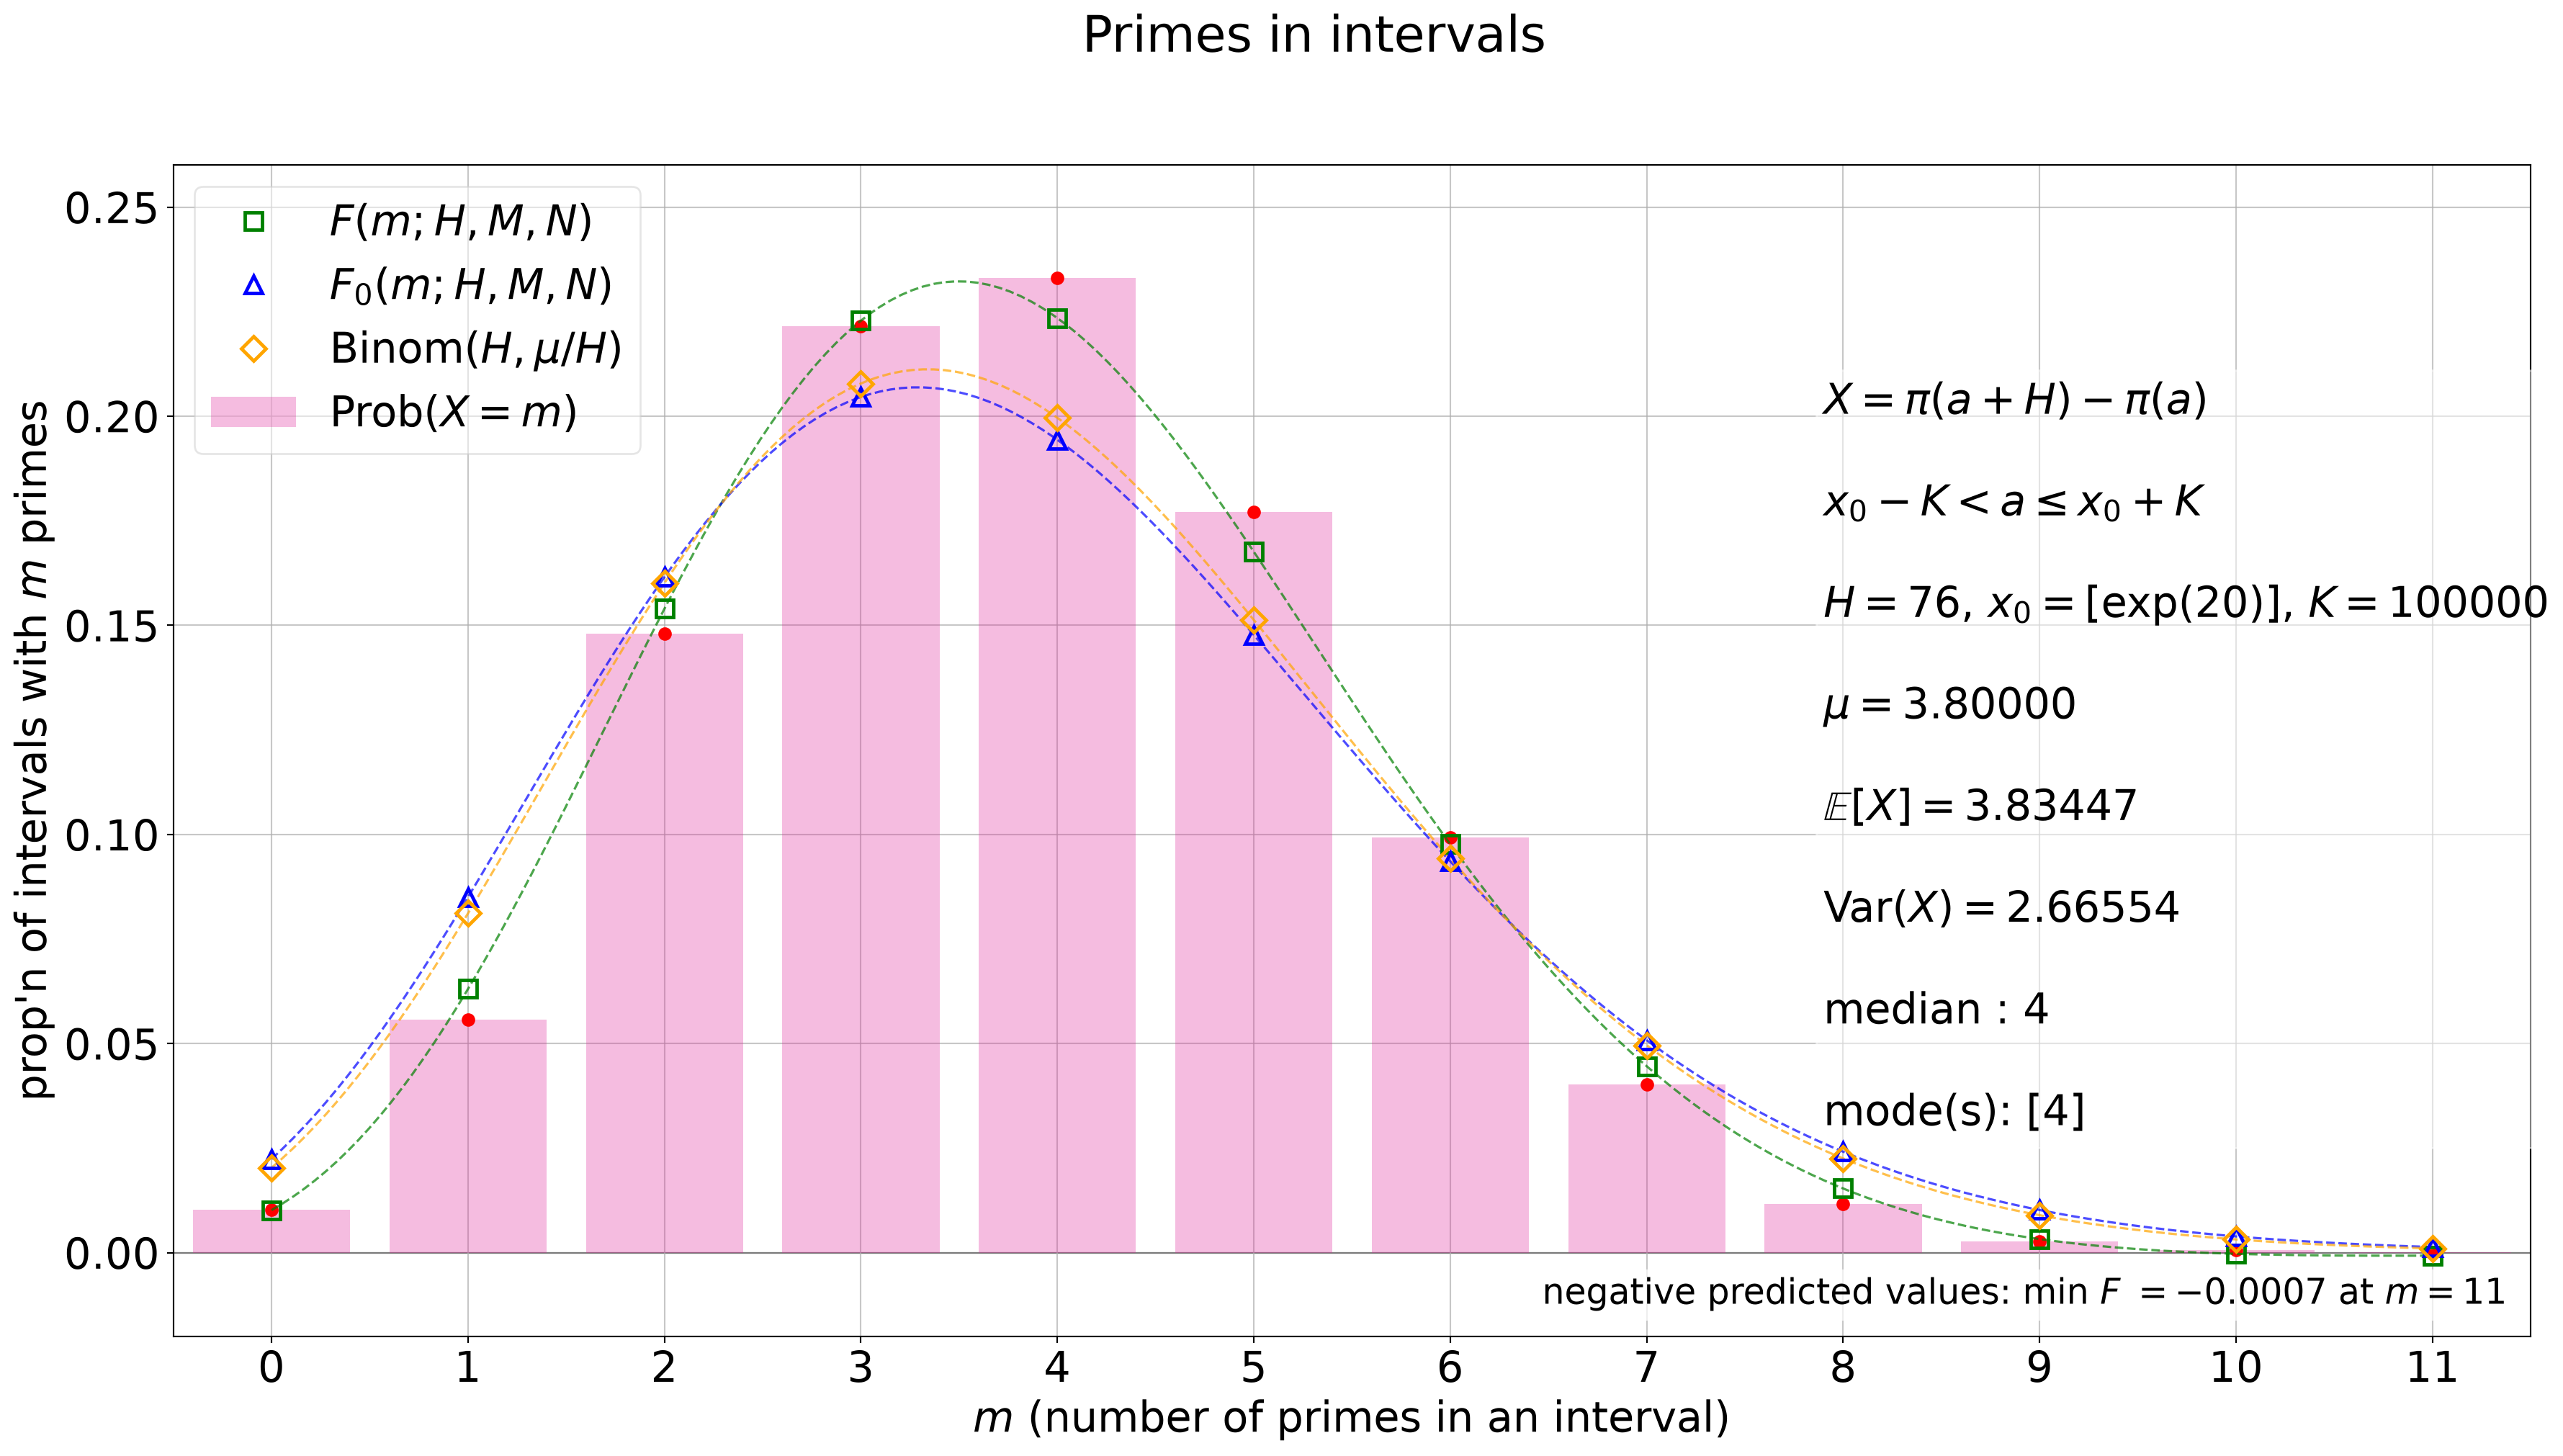
The plot shows the default trio, $F$, $F_0$ and $\mathrm{Binom}(H, \mu/H)$, with the centred text box on the final frame. Here $\mu = 76/20 = 3.8$.
```{python}
X = N_exp20_H_76
C = list(X['distribution'].keys())

fig, ax = plt.subplots(figsize=(22, 11))
fig.suptitle('Primes in intervals')
plot_distribution_frame(ax, X, C[-1],
                        overlay=centred_overlay(int(np.exp(20)), r'[\exp(20)]'),
                        overlay_position=(0.70, 0.18))
plt.show()
```
The full animation is saved with `save_gif` or `save_mp4` (or `pii animate`); the frames step through the two hundred checkpoints of the window.
## Example 6 (nested intervals) {#sec-eg6worked}
The largest run: nested intervals about $e^{21}$, thirteen interval lengths from $20$ to $140$. The checkpoints are placed symmetrically about $x_0 = [e^{21}]$, a thousand apart, with $x_0$ itself excluded, so that nesting pairs them off exactly.
```{python}
N = int(np.exp(21))
K = 199
k = (K - 1)//2 # = 99
Delta = 10**3
D = []
for j in range(k + 1):
    D.extend([N - (j + 1)*Delta, N + (j + 1)*Delta])
C = sorted(D)
HH = list(range(20,141,10))
```
```{python}
#| eval: false
EXP21 = {H : {} for H in HH}
for H in HH:
    EXP21[H] = intervals(C, H)
# Takes a few hours...
```
```{python}
#| eval: false
for H in HH:
    save(EXP21[H])
```
```{python}
EXP21 = {}
for H in HH:
    EXP21[H] = pick(retrieve(H), C[0])
```
```{python}
NEXP21 = {}
for H in HH:
    NEXP21[H] = nest(EXP21[H])
for H in HH:
    analyze(NEXP21[H])
```
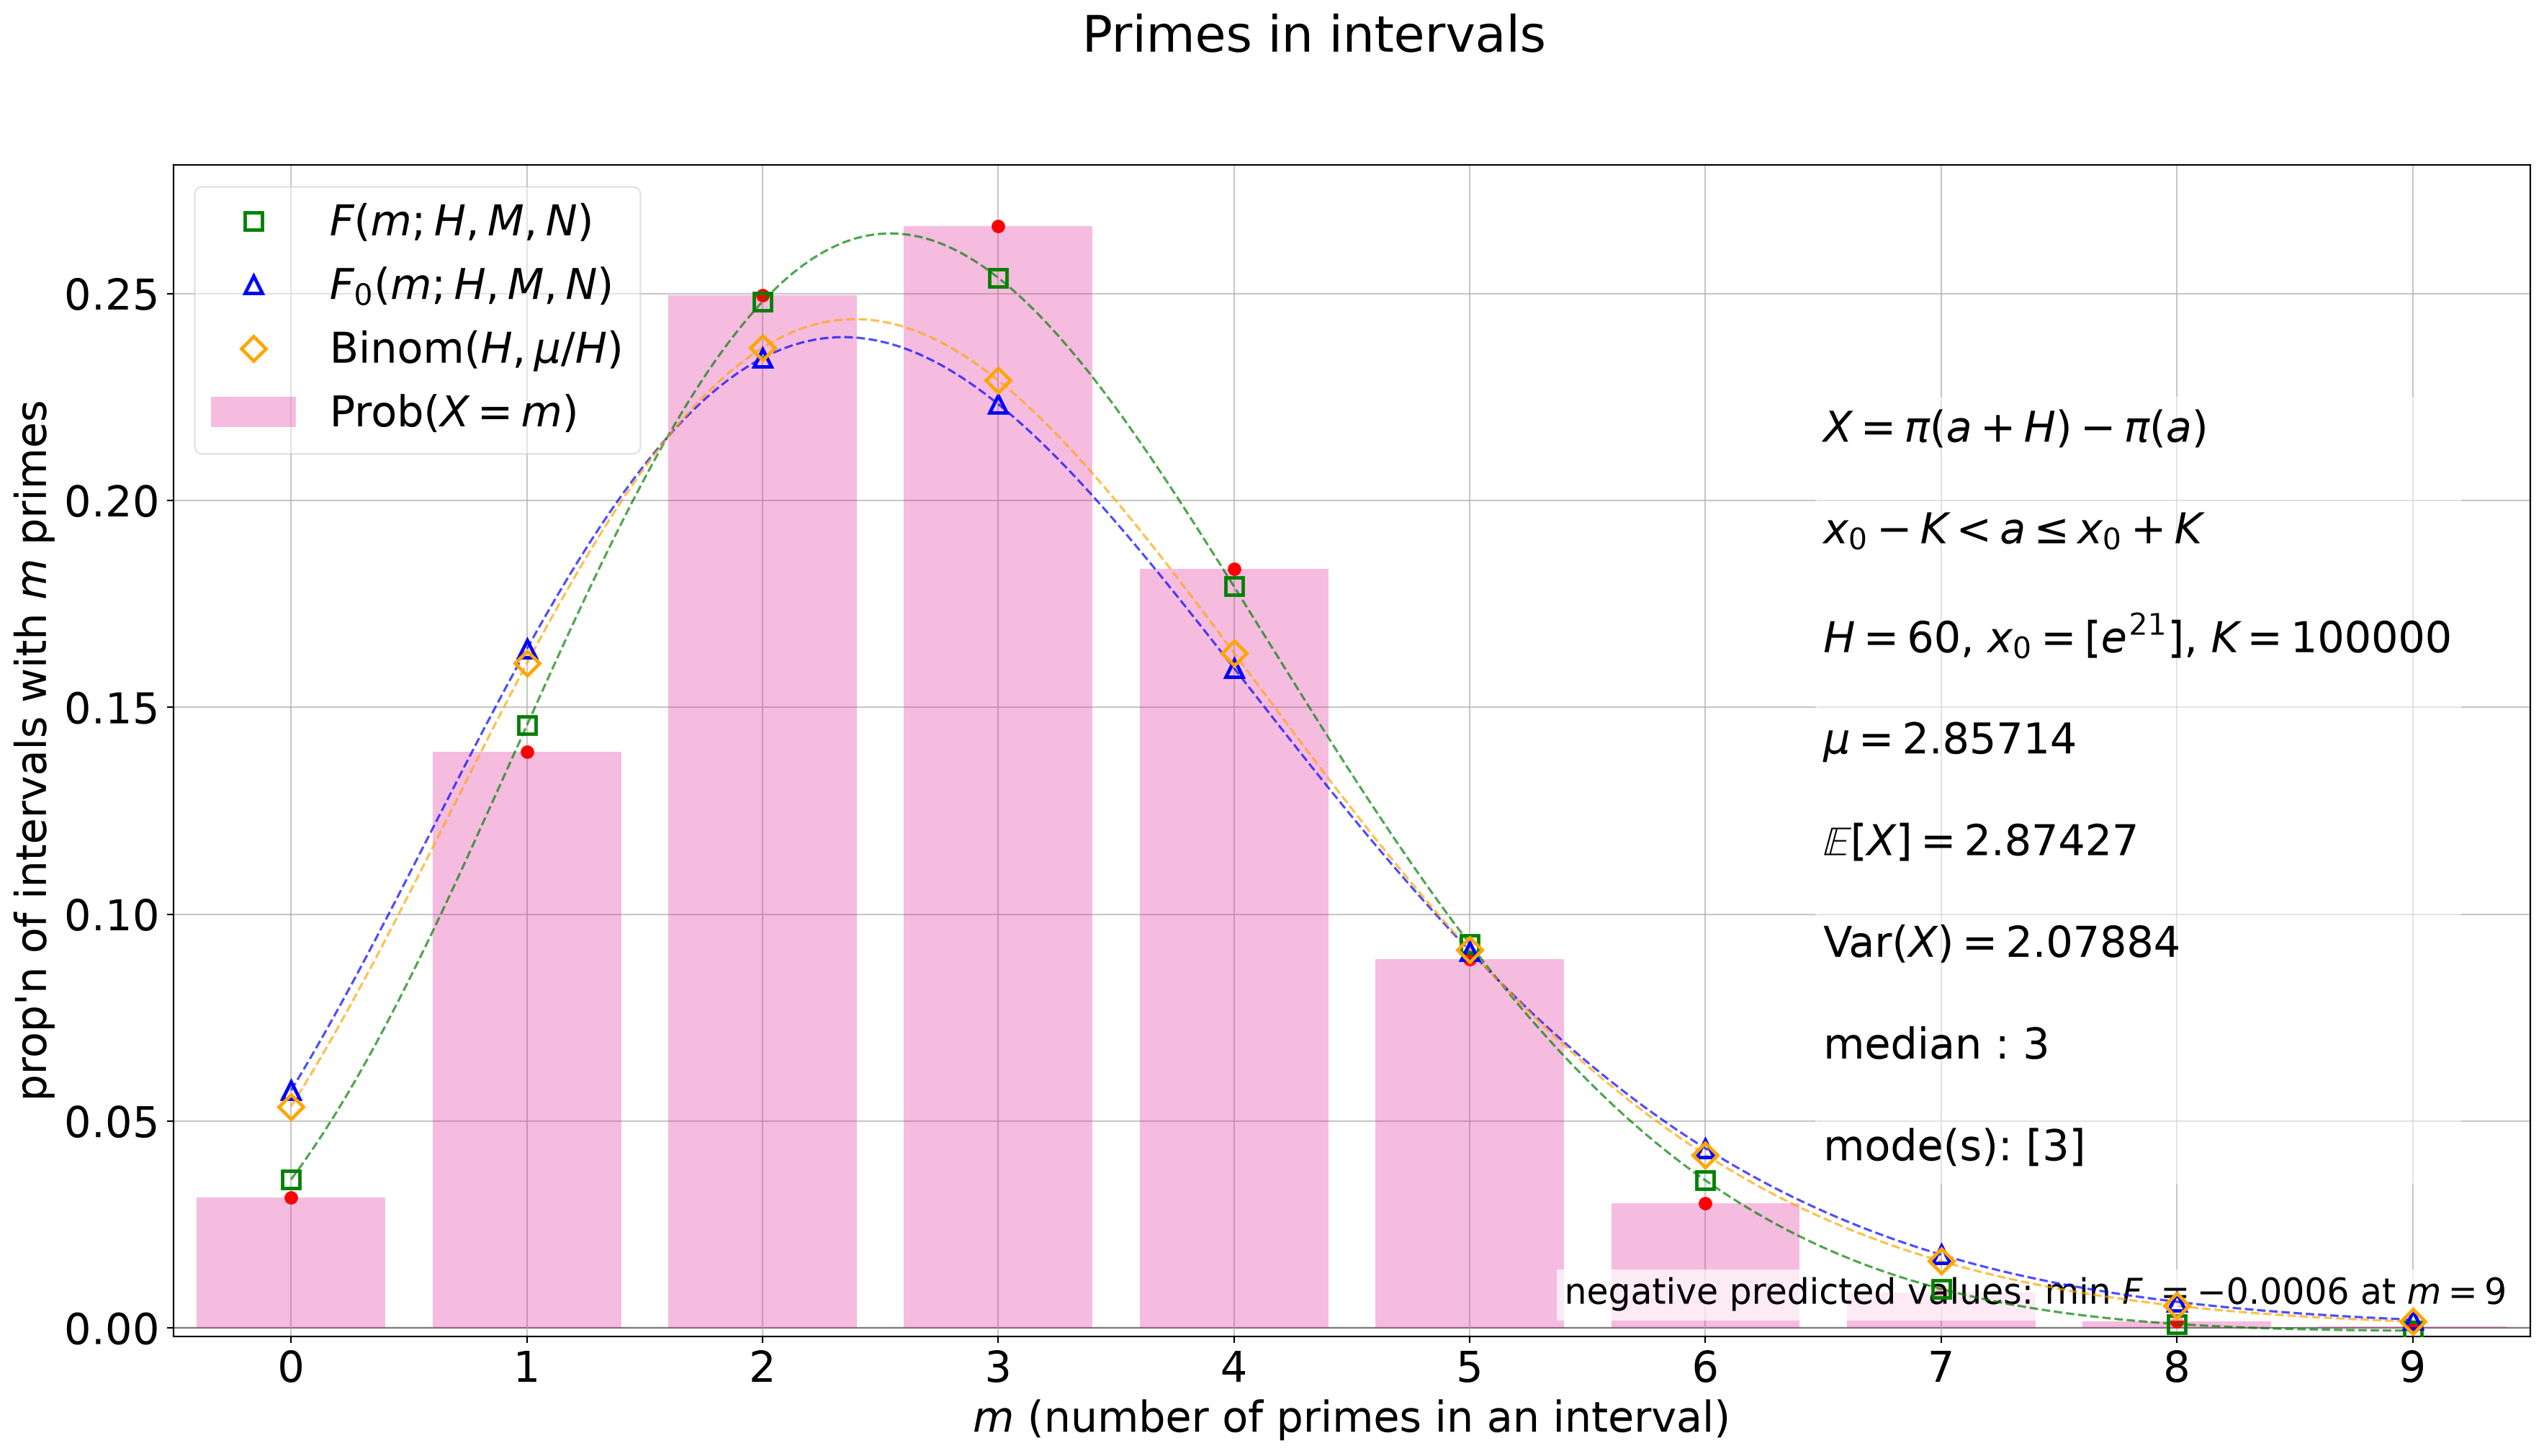
The plot, for $H = 60$, is the nested version: each frame is one of the hundred nested intervals, the innermost first, the sample growing outward from the centre, with the vertical axis rounded at the third decimal for these smaller proportions. Here $\mu = 60/21 = 2.857\ldots$.
```{python}
# HH = [20, 30, 40, 50, 60, 70, 80, 90, 100, 110, 120, 130, 140]
X = NEXP21[HH[4]]
C = list(X['distribution'].keys())

plt.rcParams.update({'font.size': 22})
fig, ax = plt.subplots(figsize=(22, 11))
fig.suptitle('Primes in intervals')
plot_distribution_frame(ax, X, C[-1], ylim_decimals=3,
                        overlay=centred_overlay(N, '[e^{21}]'), overlay_position=(0.70, 0.15))
plt.rcParams['savefig.facecolor'] = 'white'
plt.show()
```
The animation, innermost interval outward:
{fig-alt="Animation of the distribution of primes in intervals of length 60 about e^21, the nested sample growing outward from the centre, with the predictions F, F0 and the Binomial marked at each m."}
## Supplementary examples {#sec-supplementary}
Four further examples, at sizes where everything runs in seconds, so every cell below computes live: the Nachlass tables in full, the nested pipeline at $e^{17}$ for overlapping and for prime-starting intervals, and the starting points $1 \le n \le N$ of the paper's main statement. (These complement @sec-eg3display's one-line Goldschmidt table.)
### Example 1 {#sec-eg1supp}
Tables from Gauss's _Nachlass_. Create data for primes in disjoint intervals of length $100$ (starting at multiples of $100$), up to $10^7$. Checkpoints every $10^5$.
By the bye, an interval of the form $[100k, 100k + 100)$ is referred to as a "Centade" in Gauss's _Nachlass_. Analogous to the term Decade (a 10-year period from years '0 to '9), a Centade is a 100-year period from '00 to '99.
```{python}
C = list(range(0,10*10**6 + 1, 10**5))
H = 100
nachlass = pii.intervals(C,H,'disjoint')
```
Gauss and Goldschmidt summarize their data in tables of primes up to $1$ million, between $1$ and $2$ million, and so on. Let's emulate that.
```{python}
NACHLASS = { }
for i in range(1,11):
    NACHLASS[i] = pii.extract(nachlass, [(i - 1)*10**6, i*10**6] , option='narrow')
    pii.partition(NACHLASS[i])
```
Let's display one of these tables: the one for primes between $2$ and $3$ million.
```{python}
NACHLASS3df = pii.display(NACHLASS[3], count='partition', orient='columns')
NACHLASS3df
```
Here's the original: Gauss/Goldschmidt were only short by $21$ primes in the end!
{fig-alt="Facsimile of the Nachlass table tallying primes per Centade between two and three million."}
### Example 2 {#sec-eg2supp}
Let's look at a series of nested intervals centred at $x_0 = [e^{17}] = 24{,}154{,}952$. Every starting point is within $10^4$ of $x_0$, and $\log t$ changes by less than $10^{-3}$ over such a window, so the density of primes throughout it is $1/17$ to high accuracy, and the averaged parameter is $\mu = H/17$ to seven decimal places. We'll get data for intervals of length $64, 68, 72, 76, 80$, for which $\mu$ is about $3.76$, $4$, $4.24$, $4.47$ and $4.71$.
```{python}
N = int(np.exp(17))
HH = [64, 68, 72, 76, 80]
C = list(range(N - 10**4,N + 10**4 + 1, 10**2))
EXP17 = {}
for H in HH:
    EXP17[H] = pii.intervals(C, H, 'overlap')
```
Right now we have data for the intervals $(x_0 - 10^4, x_0 - 10^4 + 100k]$, $k = 1,\ldots,200$. Let's reconfigure the data to consider nested intervals $(x_0 - 100k, x_0 + 100k]$, $k = 1,\ldots,100$, all centred at $x_0$. We'll analyze the data (get the distributions and statistics) while we're at it.
```{python}
EXP17NEST = {}
for H in HH:
    EXP17NEST[H] = pii.nest(EXP17[H])
    pii.analyze(EXP17NEST[H])
```
Let's display what we have for $H = 76$ for instance.
```{python}
EXP17_76_NESTtable = pii.display(EXP17NEST[76])
EXP17_76_NESTtable.tail(5)
```
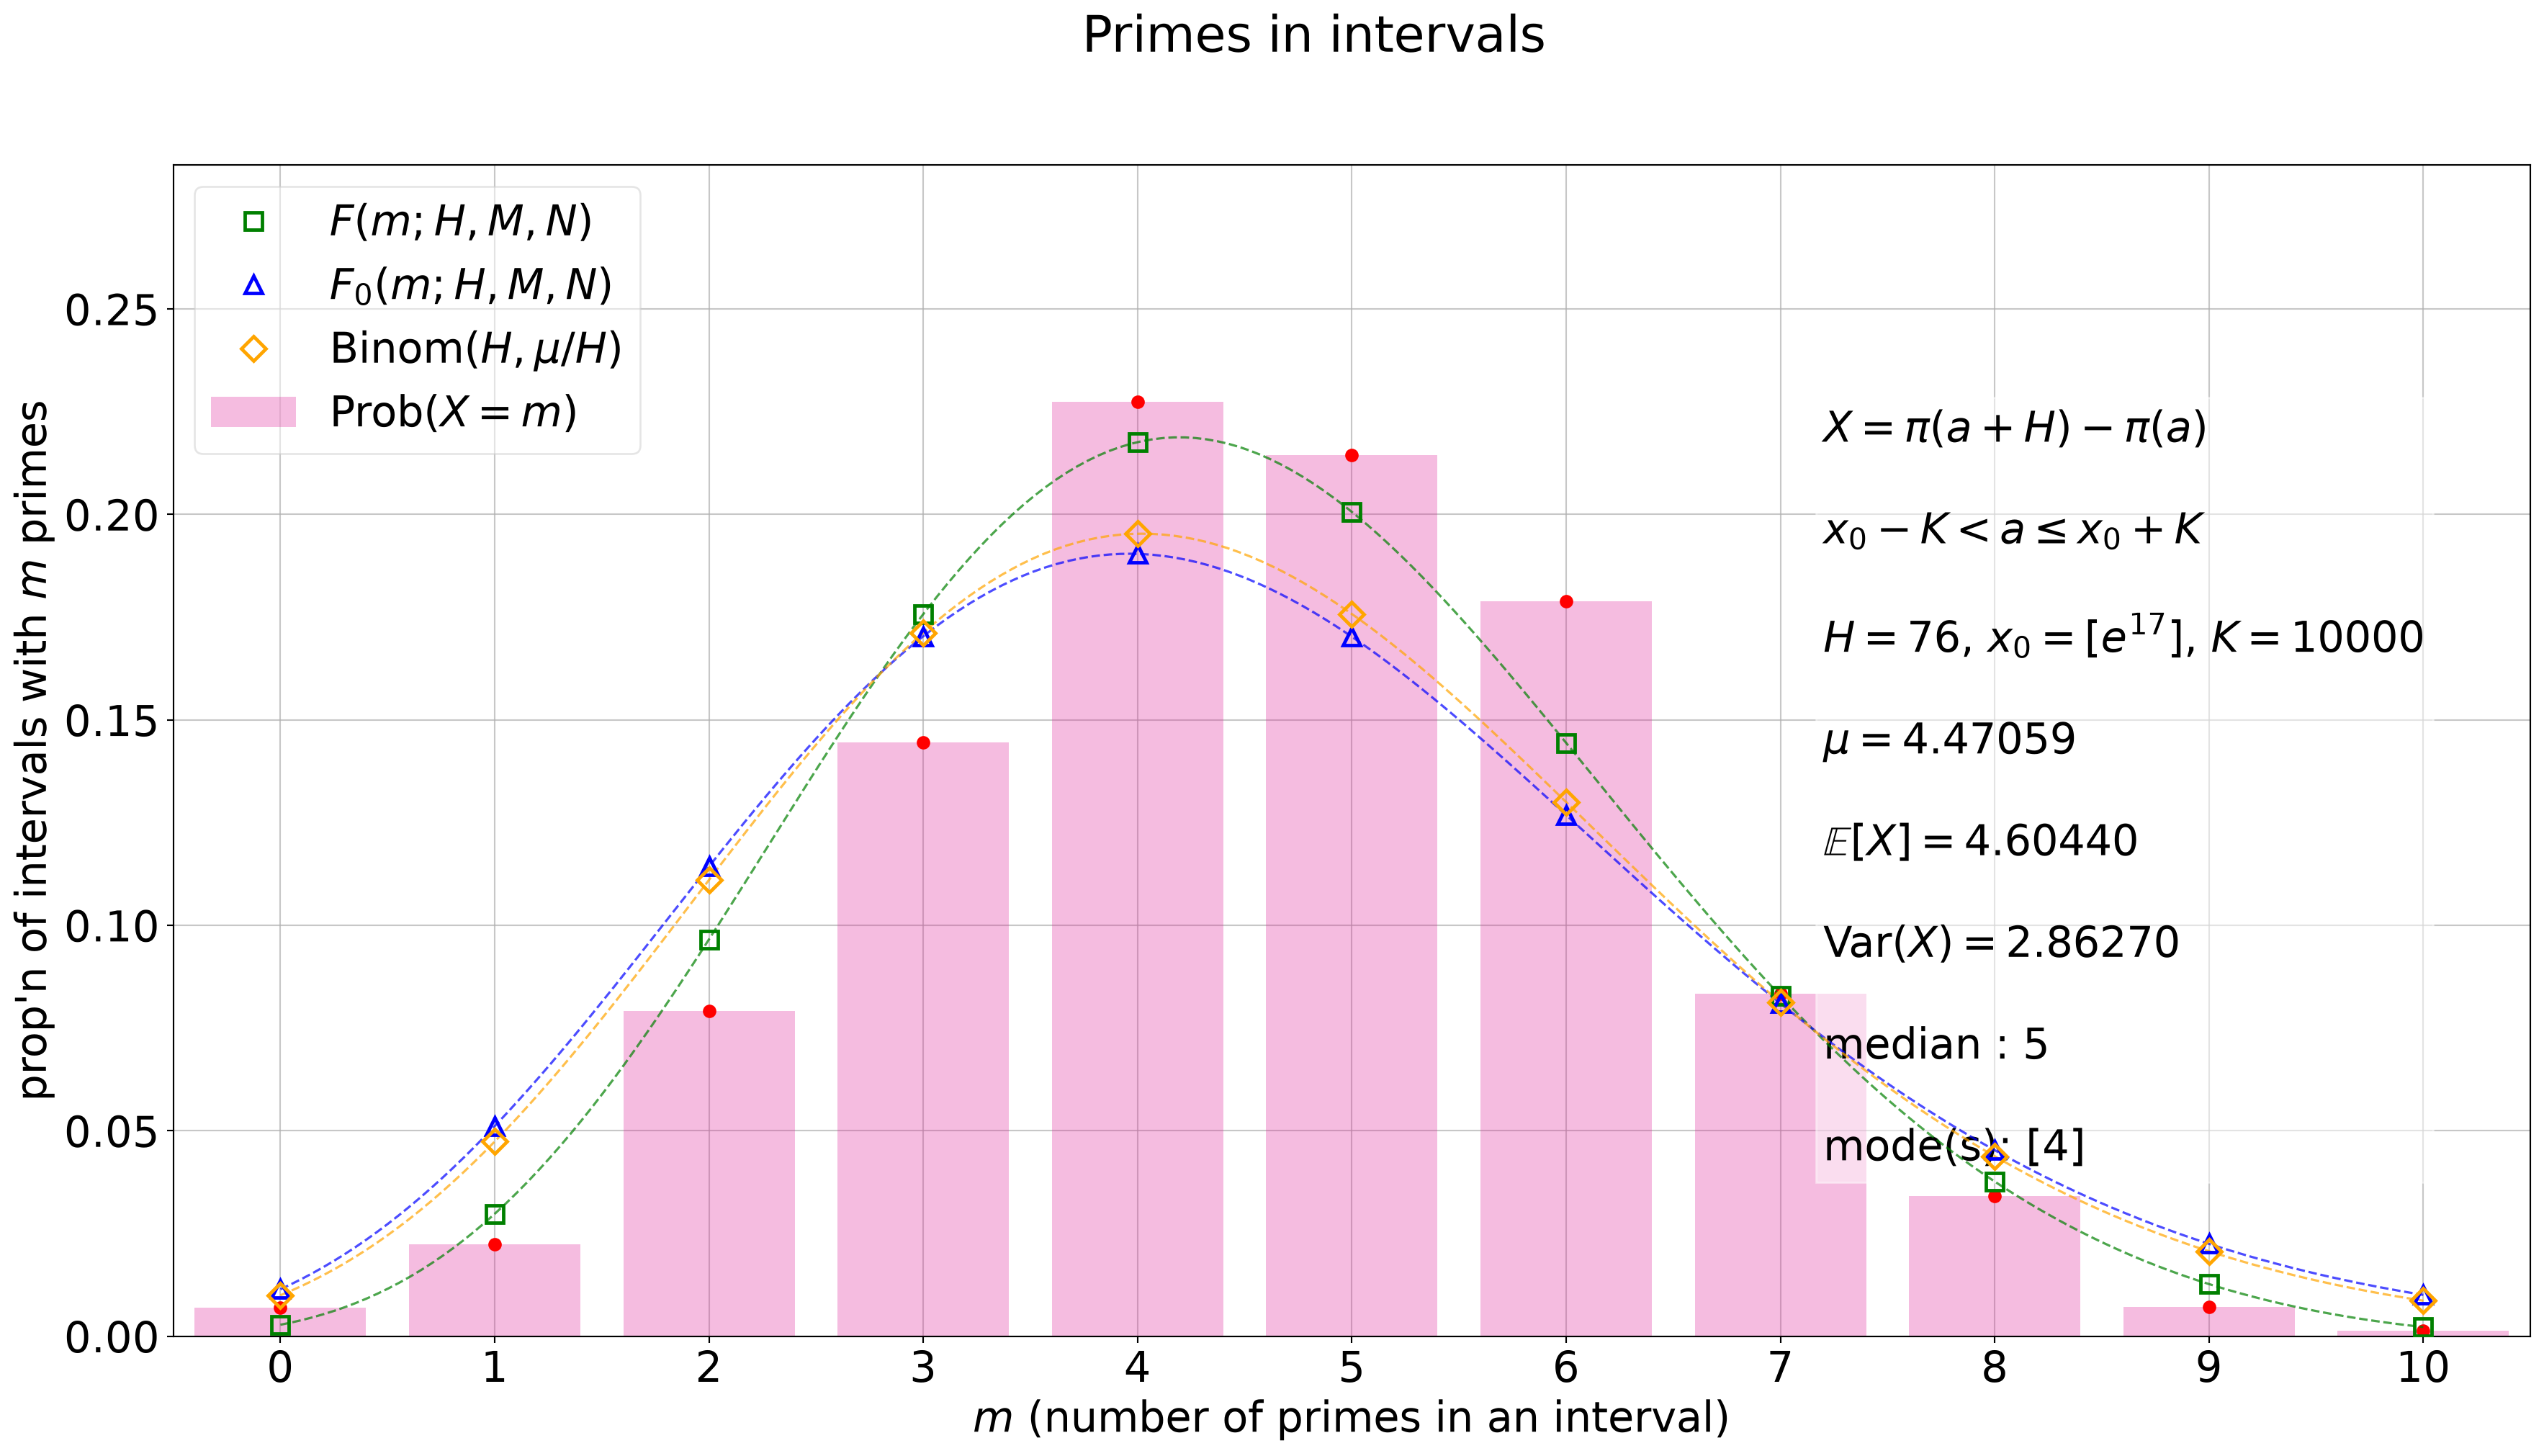
Let's compare the data (for $H = 76$) to the three predictions of @sec-compare. There is a pleasing parallel between them. The naive prediction based purely on Cramér's model is the Binomial distribution $\mathrm{Binom}(H,\mu/H)$, whose probability mass function, for $\mu$ of constant size and $H$ large, expands as
$$
\binom{H}{m}\left(\frac{\mu}{H}\right)^m\left(1 - \frac{\mu}{H}\right)^{H - m} = \frac{e^{-\mu}\mu^m}{m!}\left\{1 - \frac{C_2(m; \mu)}{2H} + O\left(\frac{1}{H^2}\right)\right\}, \qquad C_2(m; u) = (m - u)^2 - m.
$$
The local expression of @sec-predictions is
$$
Q(m; \mu, H) = \frac{e^{-\mu}\mu^m}{m!}\left\{1 - \frac{C_2(m; \mu)}{2H}\big(\log H + \log 2\pi + \gamma - 1\big)\right\}.
$$
So the correction has exactly the shape of the Binomial's first-order term, but it is larger by the factor $\log H + \log 2\pi + \gamma - 1$, which is about $5.7$ when $H = 76$. The primes deviate from the Poisson law in the same direction as the independent Bernoulli trials of Cramér's model do, but several times more strongly. The prediction $F$ averages this local expression over the window, and $F_0$ averages the Poisson term alone.
The table below shows tuples $(a,b,c,d)$, where $a$ is the actual number, $b$ is the Binomial prediction, $c$ is $F$, and $d$ is $F_0$. We'll just show the last five rows, as the table is a bit long and hard to read.
```{python}
pii.compare(EXP17NEST[76])
EXP17_76_NESTcompare = pii.display(EXP17NEST[76], comparisons='absolute').tail(5)
EXP17_76_NESTcompare
```
Which prediction is closest, and by how much, is hard to see by glancing at the above table. The discrepancy measures of @sec-discrepancy answer it. Here is $E_1$ for every tenth nested interval, on the central range, with the ratio $E_1(F)/E_1(F_0)$:
```{python}
pii.score(EXP17NEST[76])
Cn = list(EXP17NEST[76]['nested_interval_data'].keys())
rows = {}
for c in Cn[9::10]:
    s = EXP17NEST[76]['scores'][c]
    rows[c[1] - c[0]] = {name: s['central'][name]['E1'] for name in ('B', 'F', 'F0')}
    rows[c[1] - c[0]]['E1(F)/E1(F0)'] = s['ratio']['central']['E1']
pd.DataFrame.from_dict(rows, orient='index').rename_axis('N')
```
The older scoreboard `winners` gives, for each nested interval, the squared errors and the values of $m$ at which each prediction's count is closest to the actual count:
```{python}
pii.winners(EXP17NEST[76])
EXP17_76_NESTwinners = pii.display(EXP17NEST[76], winners='show')
EXP17_76_NESTwinners.tail(10)
```
Finally, let's make an animated plot, with one frame for each of the intervals considered. Here is its final frame, drawn live:
```{python}
# HH = [64, 68, 72, 76, 80]
X = EXP17NEST[HH[3]]
C = list(X['distribution'].keys())

plt.rcParams.update({'font.size': 22})
fig, ax = plt.subplots(figsize=(22, 11))
fig.suptitle('Primes in intervals')
plot_distribution_frame(ax, X, C[-1], ylim_decimals=3,
                        overlay=centred_overlay(N, '[e^{17}]'), overlay_position=(0.70, 0.15))
plt.rcParams['savefig.facecolor'] = 'white'
plt.show()
```
And the animation itself:
{fig-alt="Animation of the distribution of primes in intervals of length 76 about e^17, the nested sample growing outward, with the predictions F, F0 and the Binomial marked at each m."}
### Example 3 {#sec-eg3supp}
Let's go through the steps of [Example 2](#sec-eg2supp), but instead of counting all intervals of the form $(a, a + H]$ as $a$ runs over all integers in the range $(x_0 - 10^4, x_0 + 10^4]$, let's consider only intervals of the form $(p, p + H]$ as $p$ runs over only the _primes_ in that range. We have not worked through the details of the second-order term in this case, but to first order we should still see the Poisson distribution.
First we generate the data using the ```'prime_start'``` option in our ```intervals``` function.
```{python}
N = int(np.exp(17))
HH = [64, 68, 72, 76, 80]
C = list(range(N - 10**4,N + 10**4 + 1, 10**2))
PSEXP17 = {}
for H in HH:
    PSEXP17[H] = pii.intervals(C, H, 'prime_start')
```
Let's centre the intervals at $x_0$ with the ```nest``` function.
```{python}
PSEXP17NEST = {}
for H in HH:
    PSEXP17NEST[H] = pii.nest(PSEXP17[H])
    pii.analyze(PSEXP17NEST[H])
```
Let's have a look at the data in a table.
```{python}
PSEXP17_76_NESTtable = pii.display(PSEXP17NEST[76])
PSEXP17_76_NESTtable.tail(5)
```
Although $F$ and $F_0$ were derived for overlapping intervals, and the second-order term for intervals starting at primes might well be different, we can nevertheless compare the data to them...
```{python}
pii.compare(PSEXP17NEST[76])
PSEXP17_76_NESTcompare = pii.display(PSEXP17NEST[76], comparisons='absolute').tail(5)
PSEXP17_76_NESTcompare
```
...and see how far off each of these not-really-predictions is:
```{python}
pii.score(PSEXP17NEST[76])
c = list(PSEXP17NEST[76]['nested_interval_data'].keys())[-1]
pd.DataFrame(PSEXP17NEST[76]['scores'][c]['central']).loc[['E1', 'E2', 'Einf']]
```
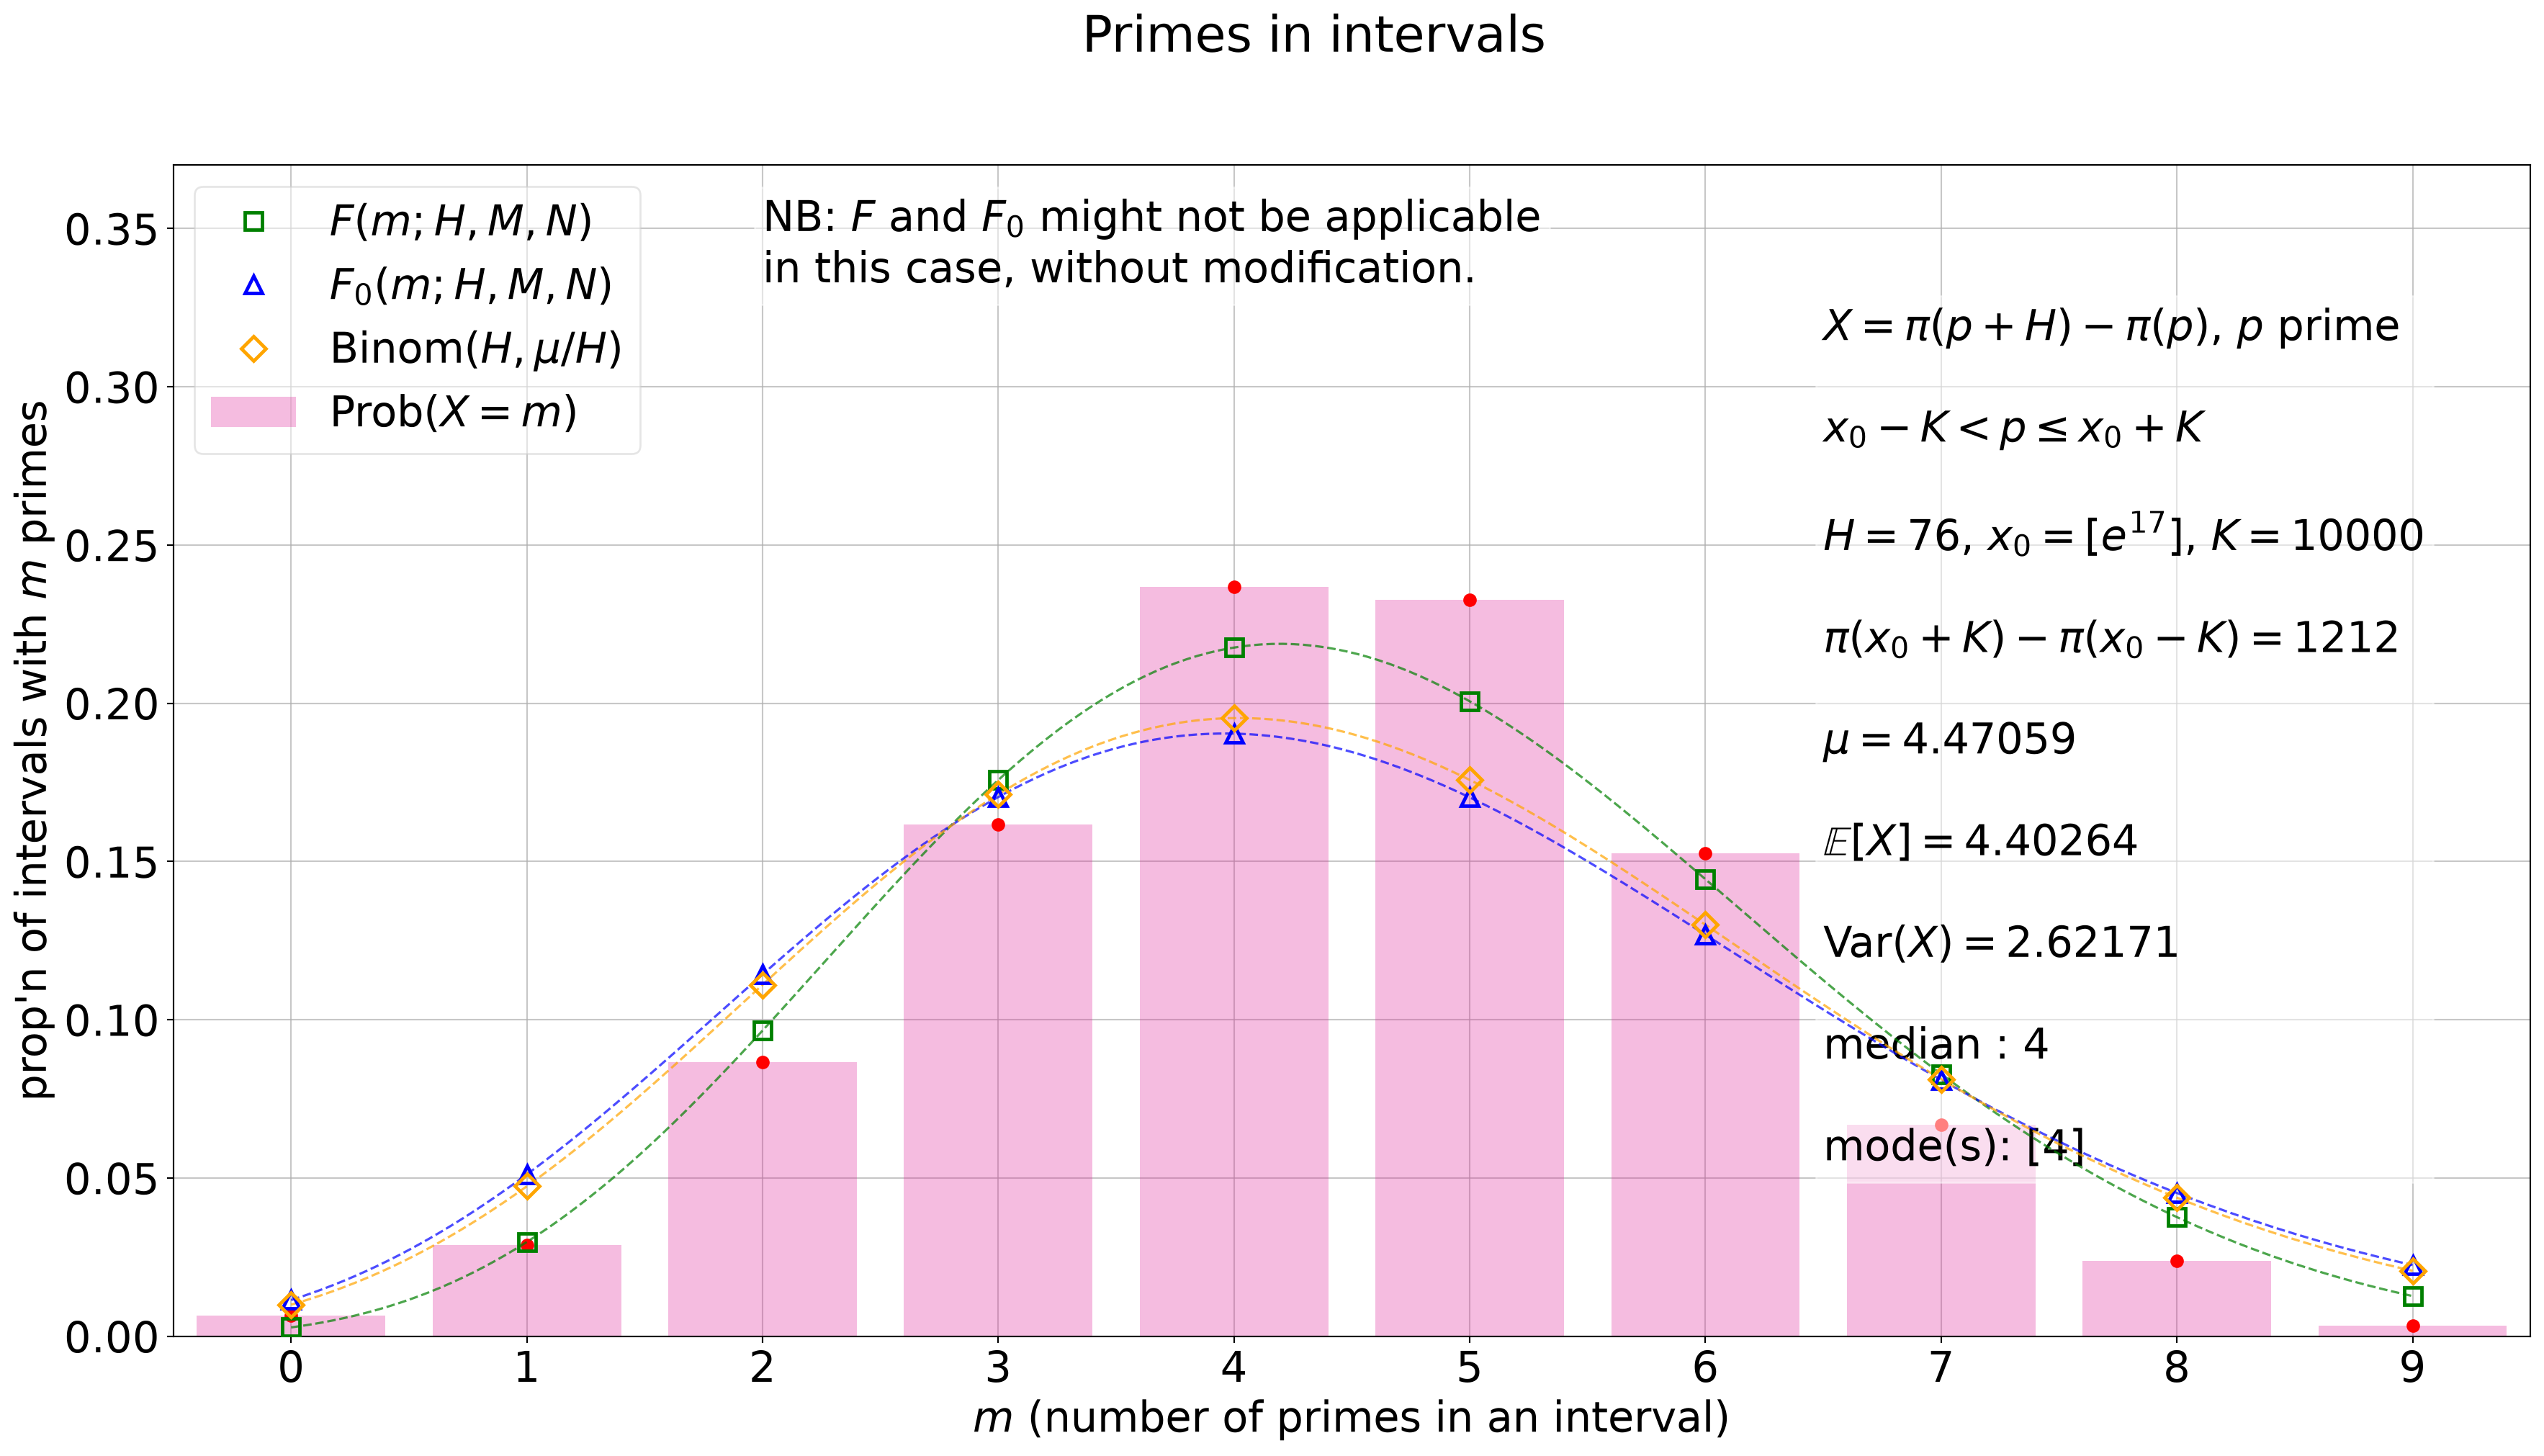
With only about twelve hundred intervals in the widest window (one for each prime in it), the data are noisy, and no conclusion should be drawn from these numbers. Here is the final frame, with $F$ and $F_0$ drawn alongside the Binomial and a caveat boxed at the top:
```{python}
# HH = [64, 68, 72, 76, 80]
X = PSEXP17NEST[HH[3]]
C = list(X['distribution'].keys())
c = C[-1]
PI = sum(X['nested_interval_data'][c].values())

fig, ax = plt.subplots(figsize=(22, 11))
fig.suptitle('Primes in intervals')
plot_distribution_frame(ax, X, c, models=('F', 'F0', 'B_const'),
                        note='NB: $F$ and $F_0$ might not be applicable' + '\n' + 'in this case, without modification.',
                        overlay=centred_overlay(N, '[e^{17}]',
                                                variable=r'$X = \pi(p + H) - \pi(p)$, $p$ prime',
                                                start='p',
                                                extra=fr'$\pi(x_0 + K) - \pi(x_0 - K) = {PI}$' + '\n\n'),
                        overlay_position=(0.70, 0.15))
plt.show()
```
{fig-alt="Animation of the distribution of primes in intervals of length 76 whose left endpoints are prime, about e^17, with F, F0 and the Binomial marked at each m and a caveat that F and F0 may not apply."}
### Example 4 {#sec-eg4supp}
Every window so far has been narrow and far from the origin, so that the density of primes hardly changes across it. The paper's main statement concerns instead all the starting points $1 \le n \le N$, that is, $M = 0$, across which the density $1/\log t$ changes considerably. The predictions $F$ and $F_0$ average over that change exactly as they are defined, and nothing else about them needs adjusting. Here we take $N = 10^7$ and $H = 45$, which is $3(\log N - 1)$ rounded to the nearest integer, so that the mean number of primes in an interval is close to $3$.
In this setting $\lambda = H/(\log N - 1)$ (@sec-predictions). The prime number theorem gives
$$
\frac{1}{N}\int_2^N \frac{dt}{\log t} = \frac{1}{\log N} + \frac{1}{(\log N)^2} + O\left(\frac{1}{(\log N)^3}\right) = \frac{1}{\log N - 1} + O\left(\frac{1}{(\log N)^3}\right),
$$
so $\lambda$ is a two-term approximation to $\mu$. The $-1$ comes from averaging $1/\log t$ over all $t$ up to $N$, most of which are smaller than $N$; the density near $N$ is $1/\log N$.
Besides $F$ and $F_0$ we evaluate the local expressions $Q(m; \lambda, H)$ and $Q(m; \mu, H)$, and the Binomial of Cramér's model with its varying density,
$$
B_{\mathrm{avg}}(m) = \frac{1}{N}\int_e^N \binom{H}{m}\left(\frac{1}{\log t}\right)^m\left(1 - \frac{1}{\log t}\right)^{H - m}dt,
$$
the lower limit $e$ keeping the probability $1/\log t$ at most $1$. With the density this far from constant, $\mathrm{Binom}(H, \mu/H)$ would be a poor stand-in for Cramér's model, and $B_{\mathrm{avg}}$ takes its place.
The function `run_cumulative` counts the primes in $(n, n + H]$ for $1 \le n \le N$ at each of a list of checkpoints $N$, in one pass, and `build_frames` computes and scores the predictions at each checkpoint. This takes a few seconds.
```{python}
from primes_in_intervals import build_frames, plot_cumulative_frame, run_cumulative

H = 45
cumulative = run_cumulative(H, checkpoints=[10**5, 10**6, 10**7])
models = ('F', 'F0', 'B_avg', 'Q_lambda', 'Q_mu')
frames = build_frames(cumulative, overlay_from=1, models=models)
```
Here is $E_1$ for each prediction and each checkpoint, on the global range of @sec-discrepancy, so that each sum covers essentially the whole of each prediction:
```{python}
pd.DataFrame({f.N: {'mu': f.predictions['mu'], 'lambda': f.predictions['lambda'],
                    **{name: f.scores['global'][name]['E1'] for name in models}}
              for f in frames}).T.rename_axis('N')
```
$F$ improves on both $F_0$ and $B_{\mathrm{avg}}$, by a factor of between three and four at $N = 10^7$. The local expressions $Q(m; \lambda, H)$ and $Q(m; \mu, H)$ do a little better still at these sizes: the average $F$ arises naturally in the argument, but it need not be the most accurate approximation at a particular finite $N$.
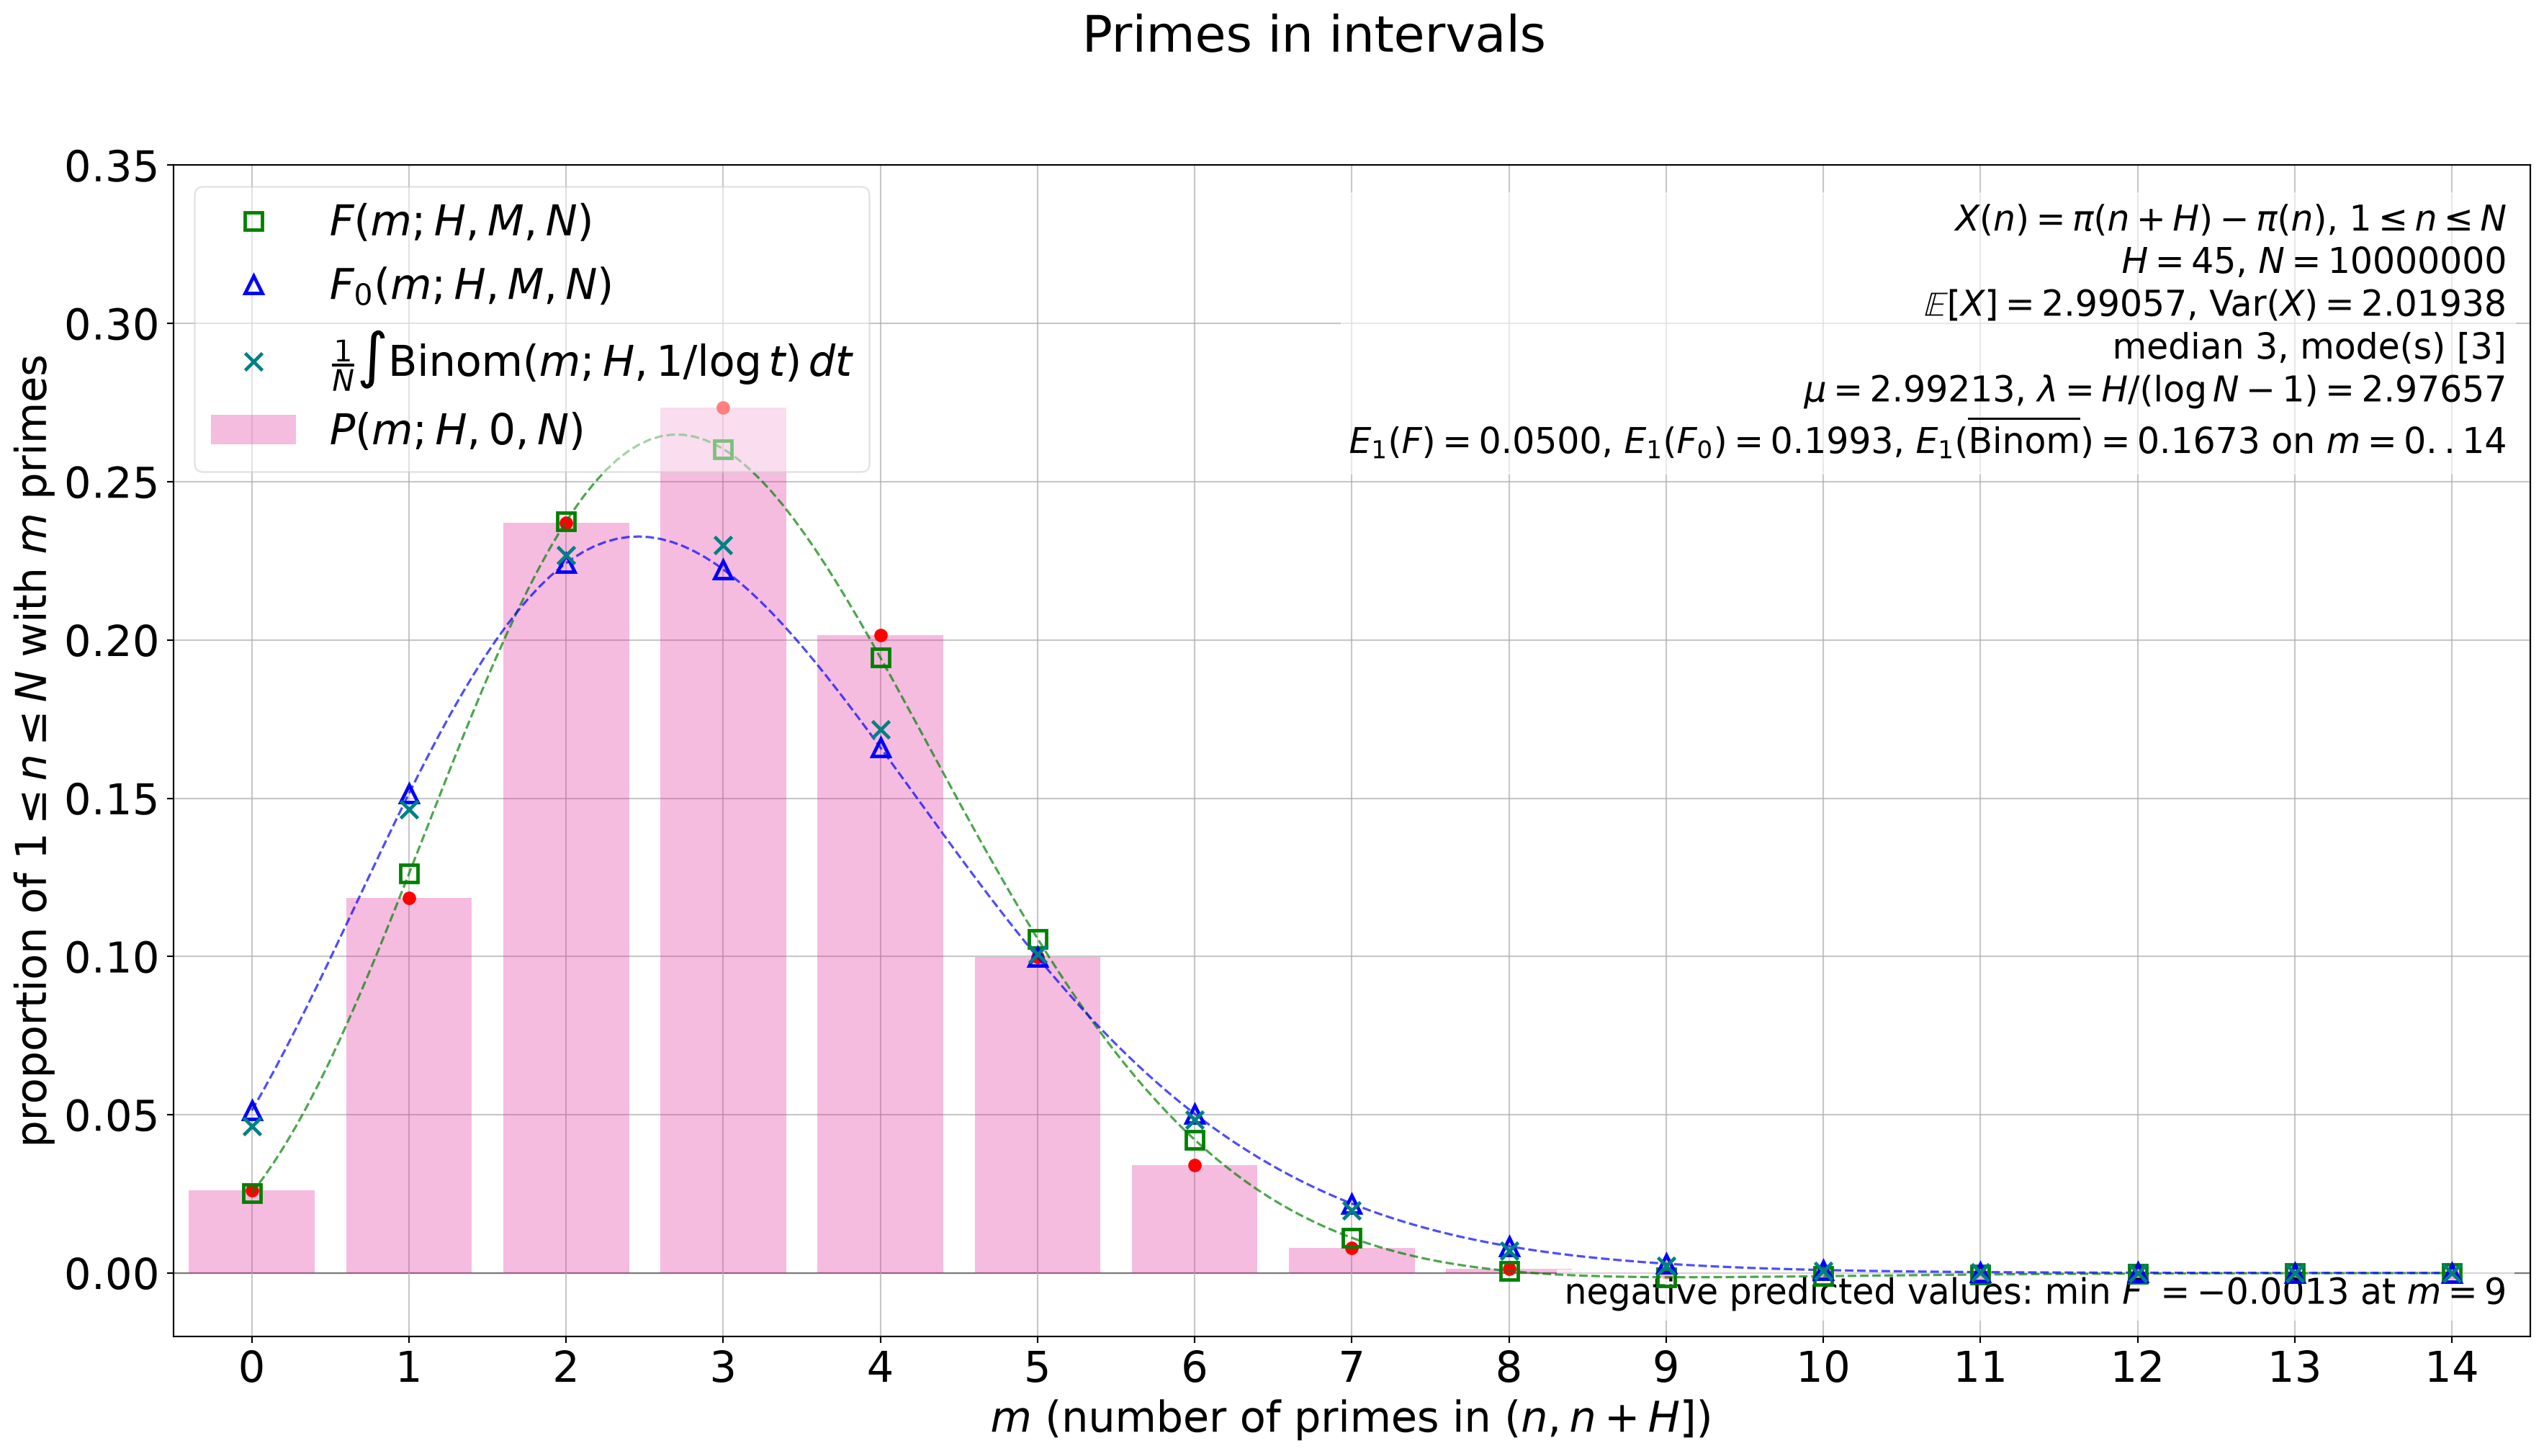
The final checkpoint:
```{python}
plt.rcParams.update({'font.size': 22})
fig, ax = plt.subplots(figsize=(22, 11))
fig.suptitle('Primes in intervals')
plot_cumulative_frame(ax, frames[-1], H, models=('F', 'F0', 'B_avg'), y_max=0.35)
plt.show()
```
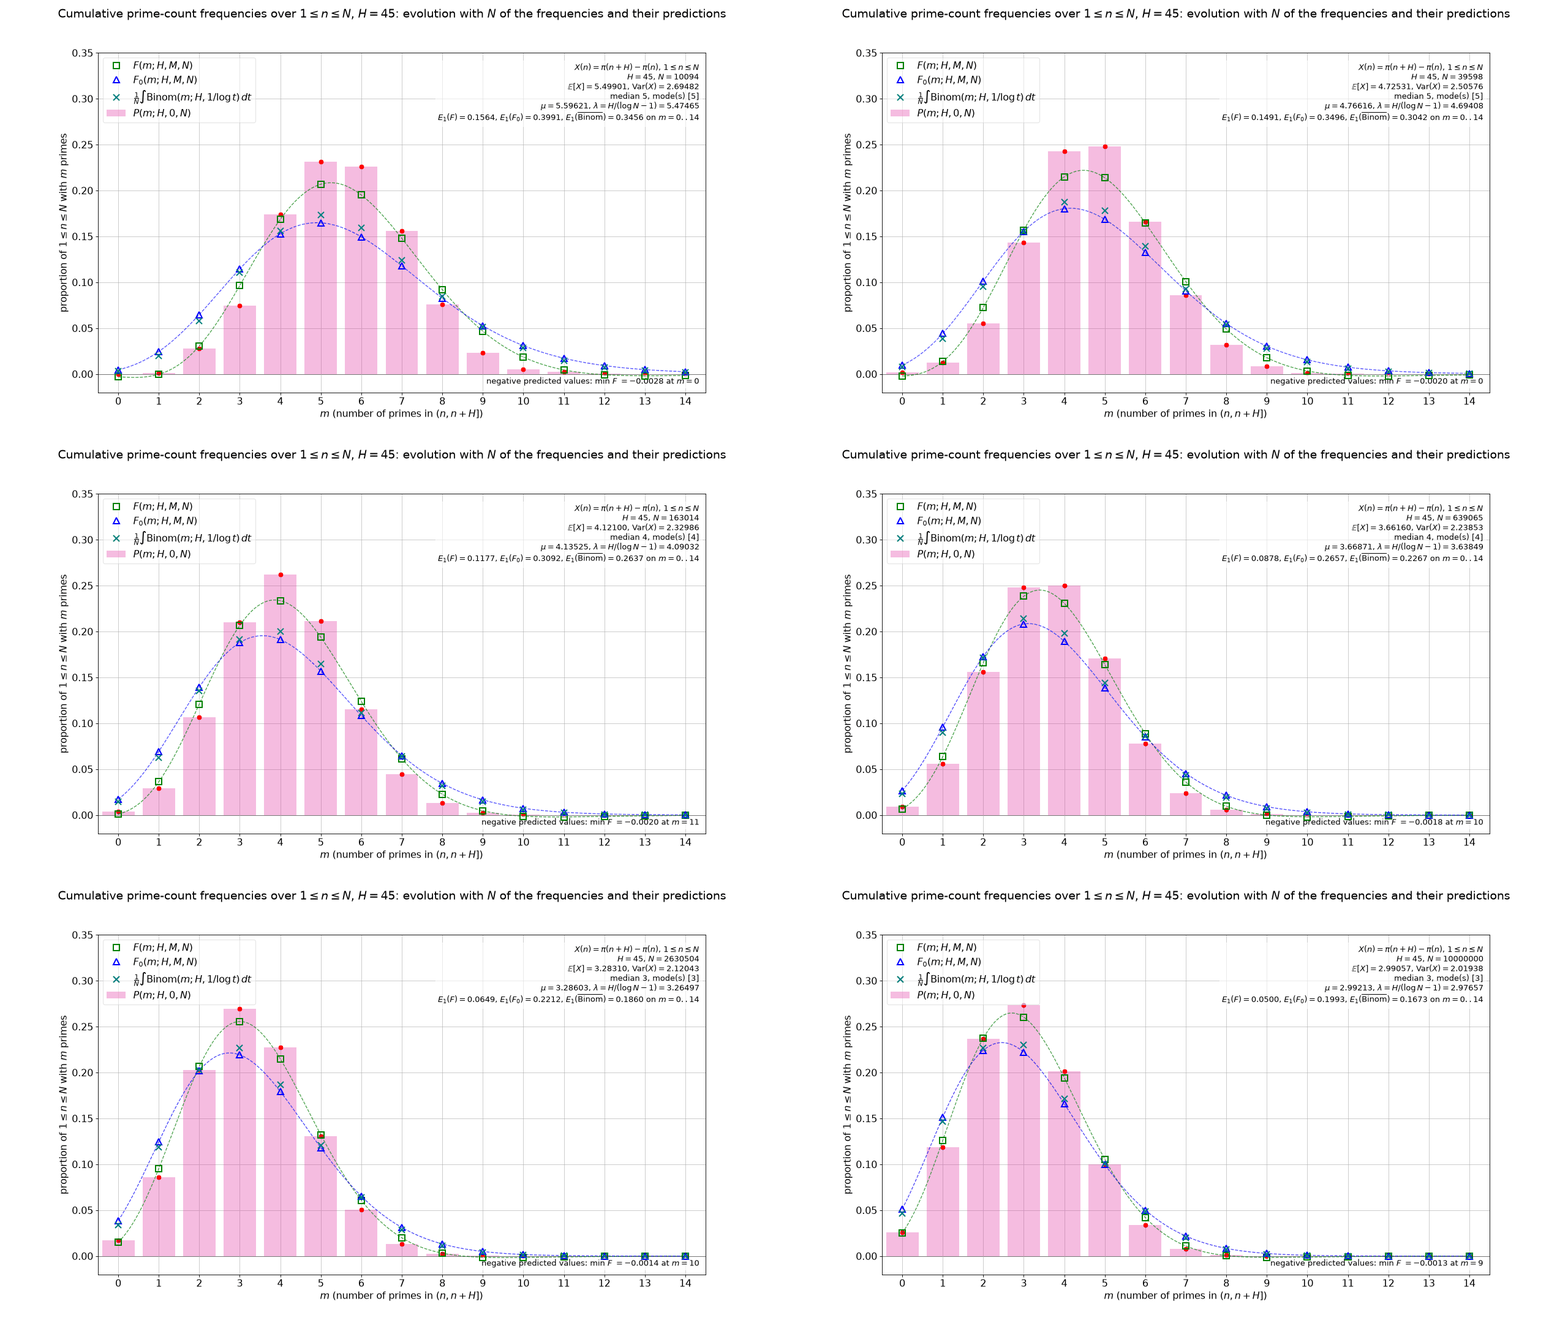
The animation shows the same comparison at every checkpoint from $N = 10^4$ to $N = 10^7$, the checkpoints about five per cent apart. As $N$ grows, the primes thin out and the mean falls, from about $5.5$ at the start to about $3$ at the end.
{fig-alt="Animation of the proportion of starting points n from 1 to N for which the interval of length 45 after n contains m primes, as N grows from ten thousand to ten million, with the predictions F (green squares), F0 (blue triangles) and the averaged Binomial (teal crosses) marked at each m."}
From the shell, `pii cumulative-run`, `pii cumulative-frames`, `pii cumulative-plot` and `pii cumulative-animate` carry out the same experiment for any $H$ and $N$, with the checkpoints running from $N = 1$ (see `docs/cli.md`).